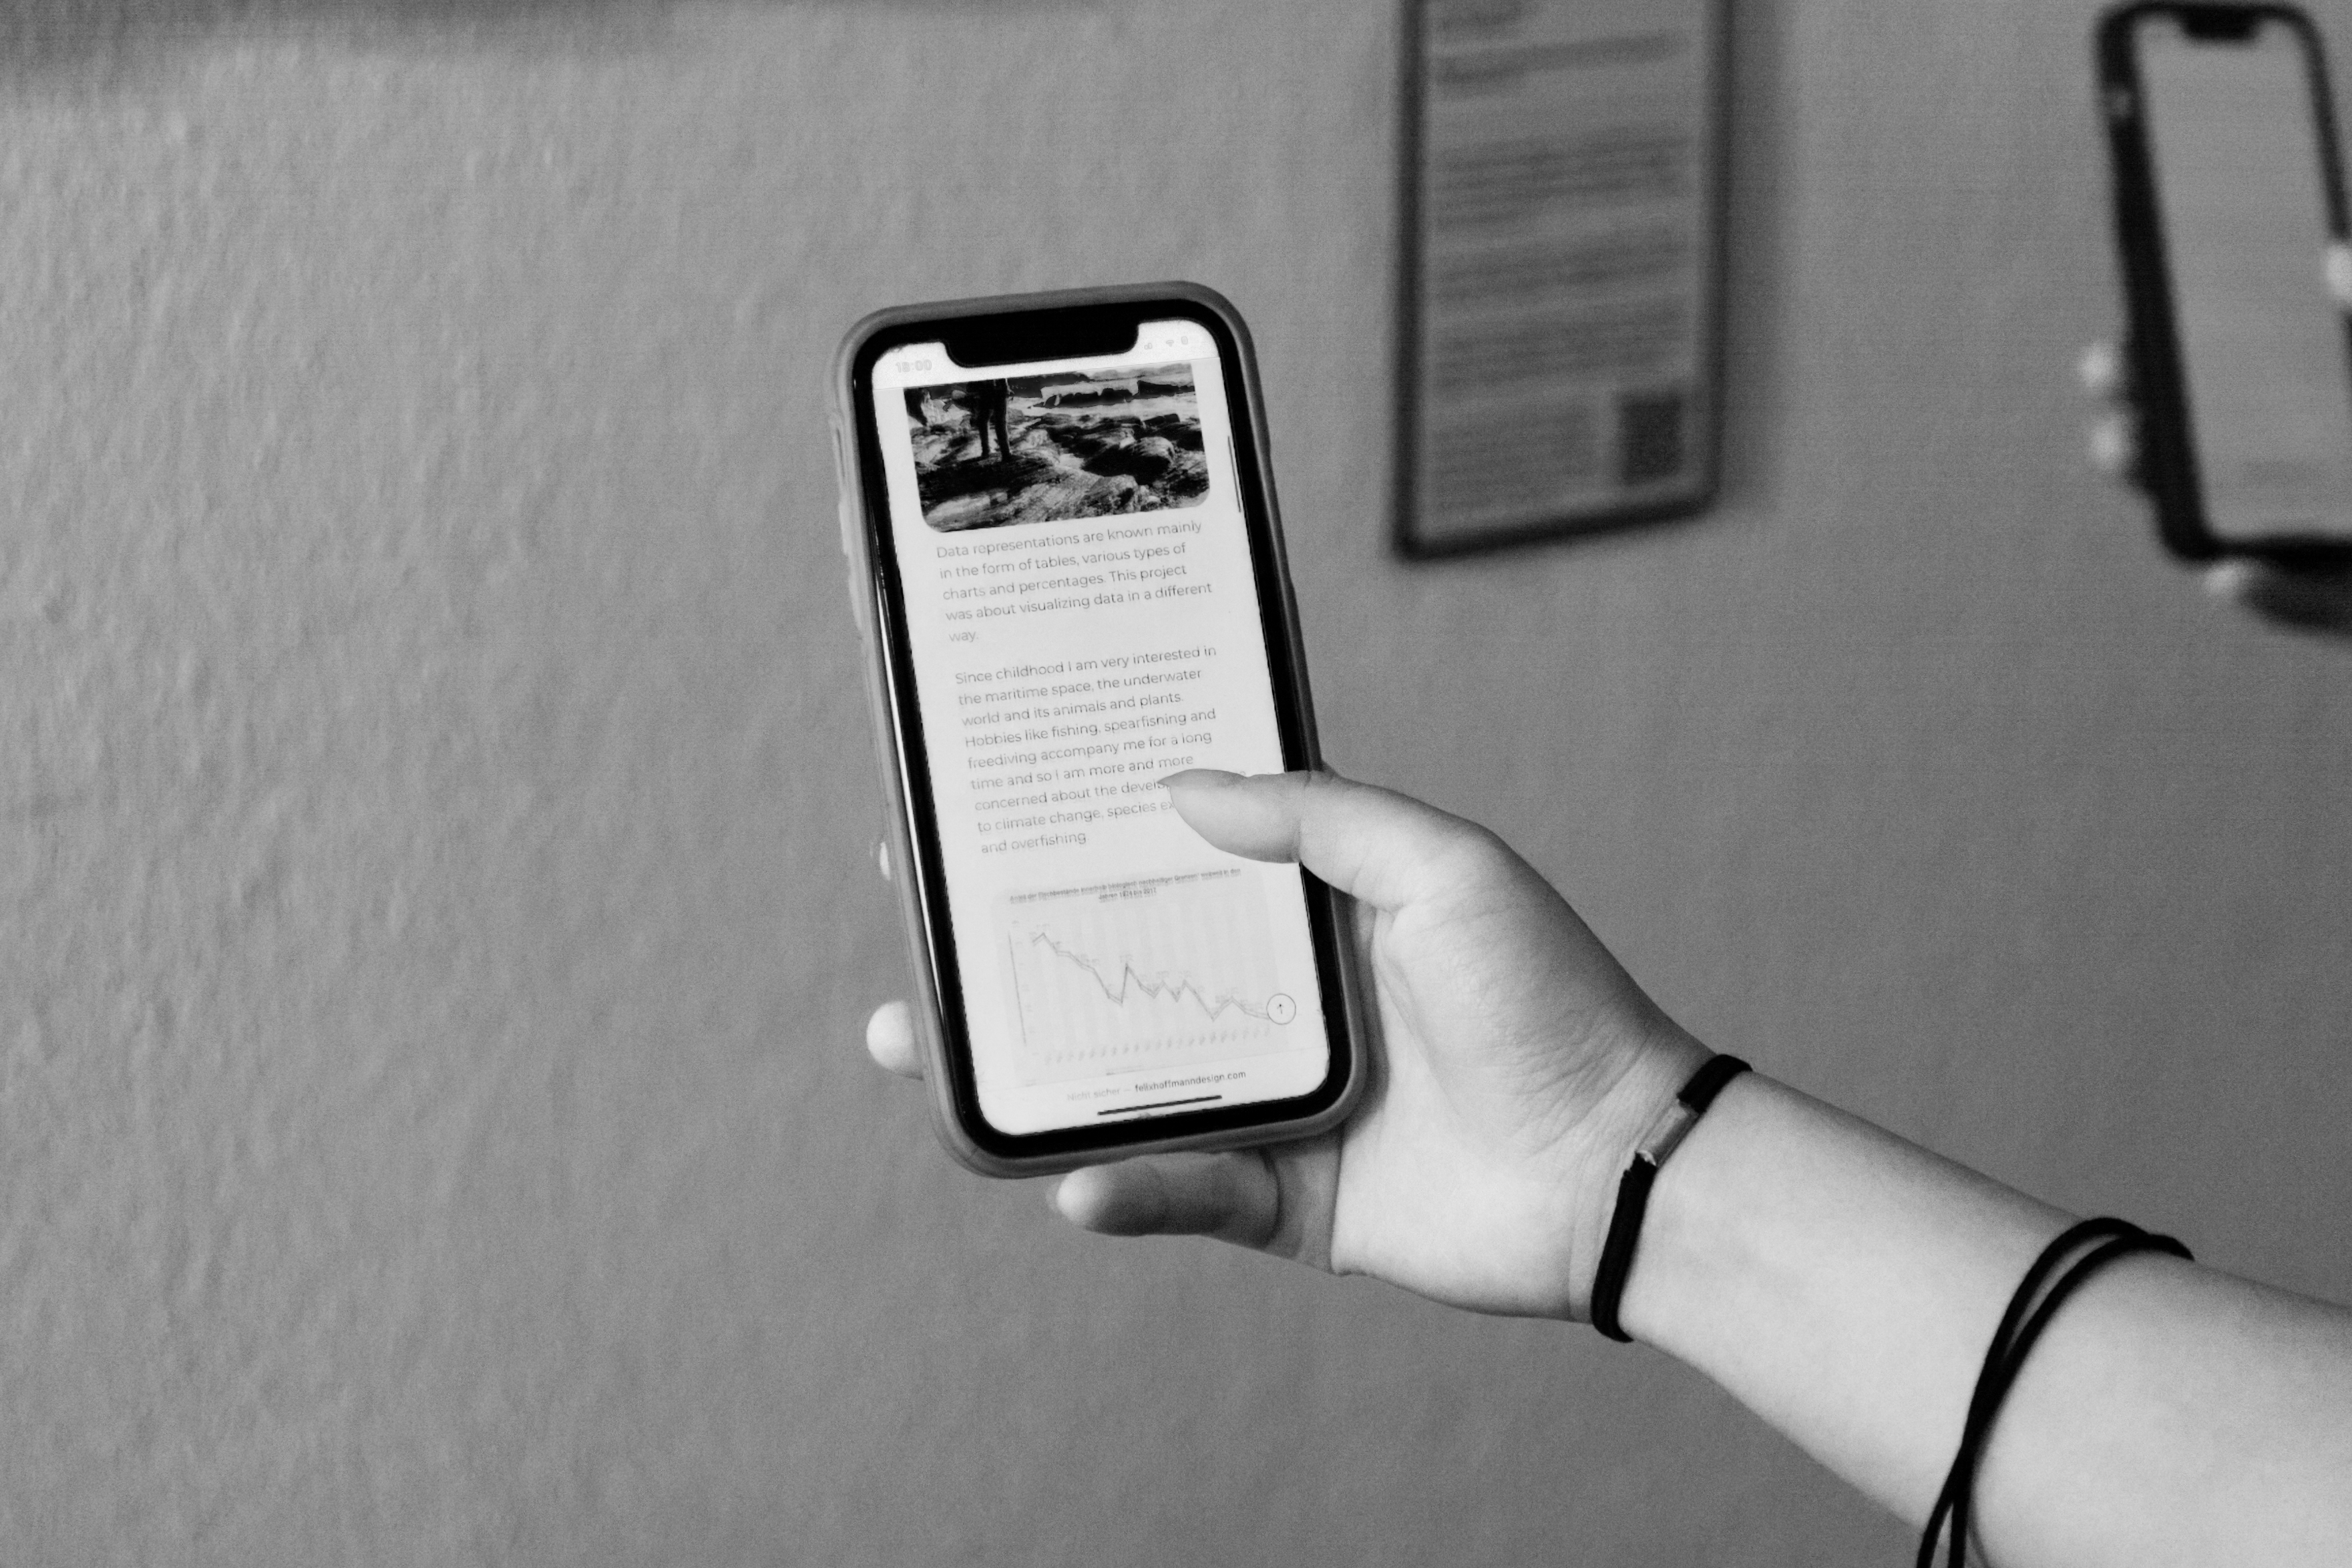
Data representations are known mainly in the form of tables, various types of charts and percentages. This project was about visualizing data in a different way.
Since childhood I am very interested in the maritime space, the underwater world and its animals and plants. Hobbies like fishing, spearfishing and freediving accompany me for a long time and so I am more and more concerned about the developments due to climate change, species extinction and overfishing.
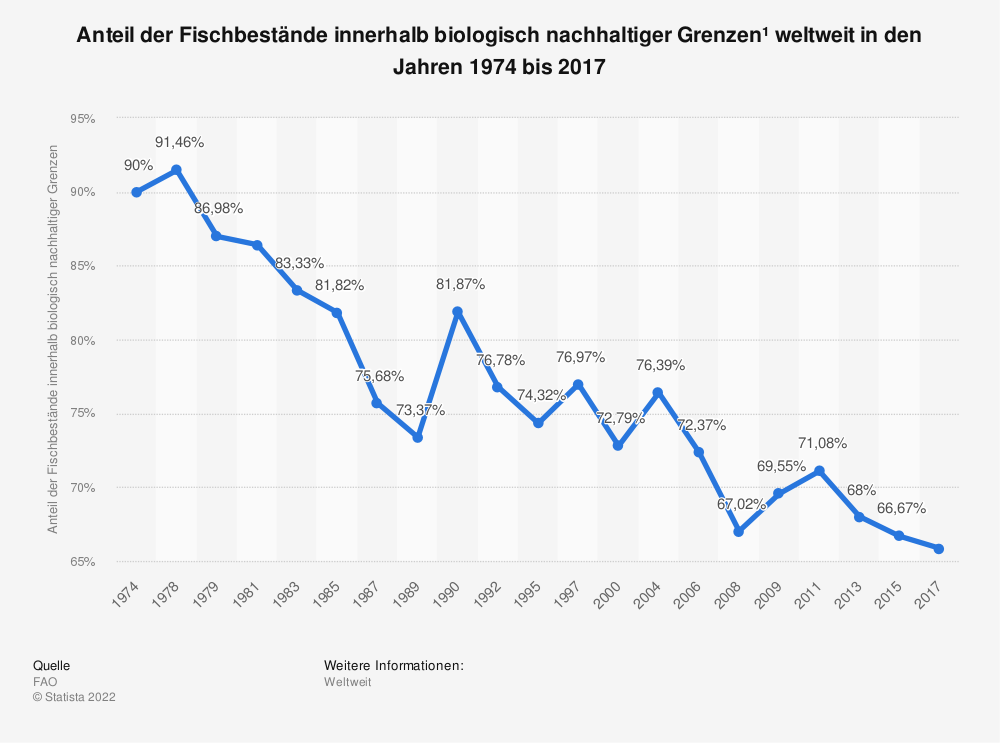
Accordingly, for this data visualization, I chose a dataset that addresses global overfishing and the decline of fish stocks within biological sustainable limits. This dataset maps the decline of these fish stocks over a period from 1974 to 2017.
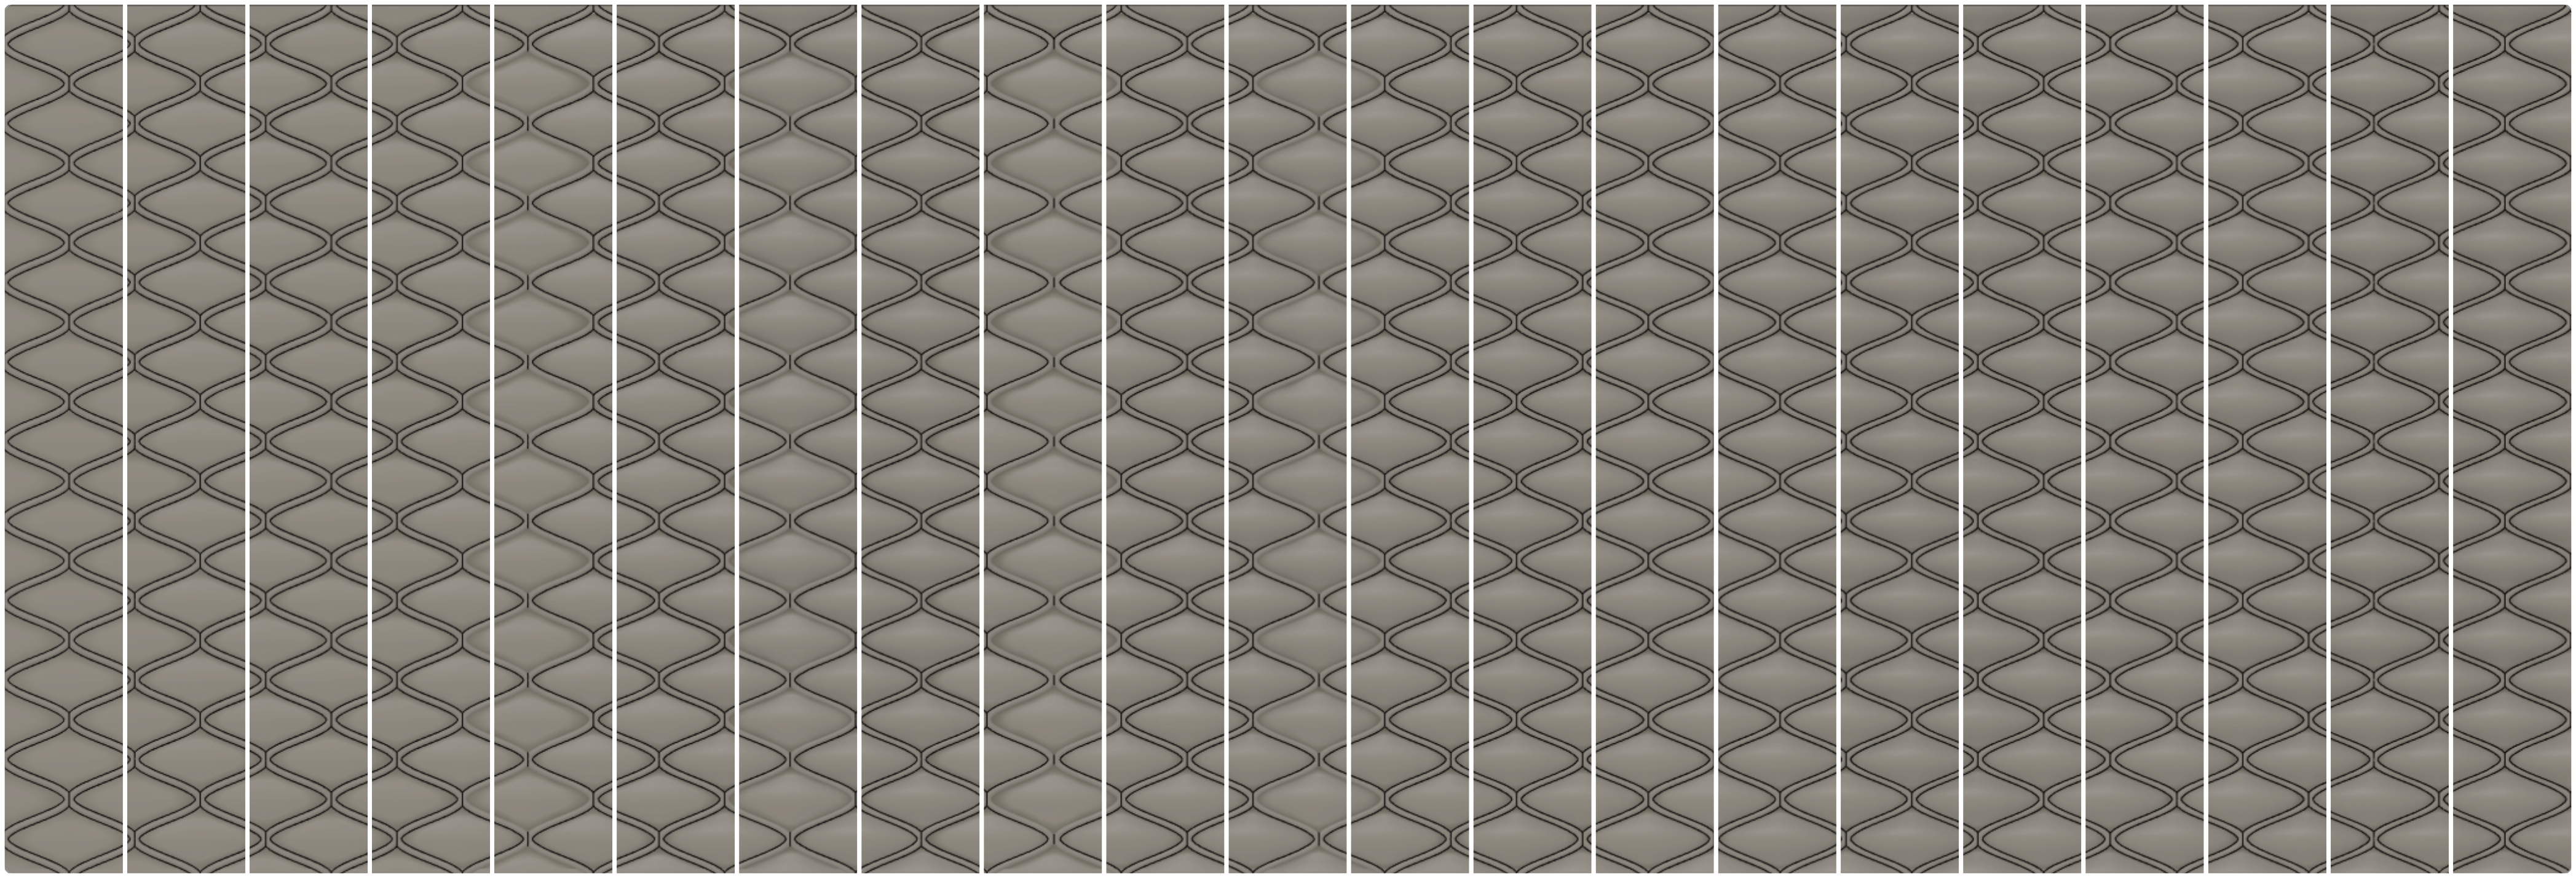
In order to depict this development, I have decided to highlight the individual values of the development in order to be able to apply them as individual factors for the presentation.
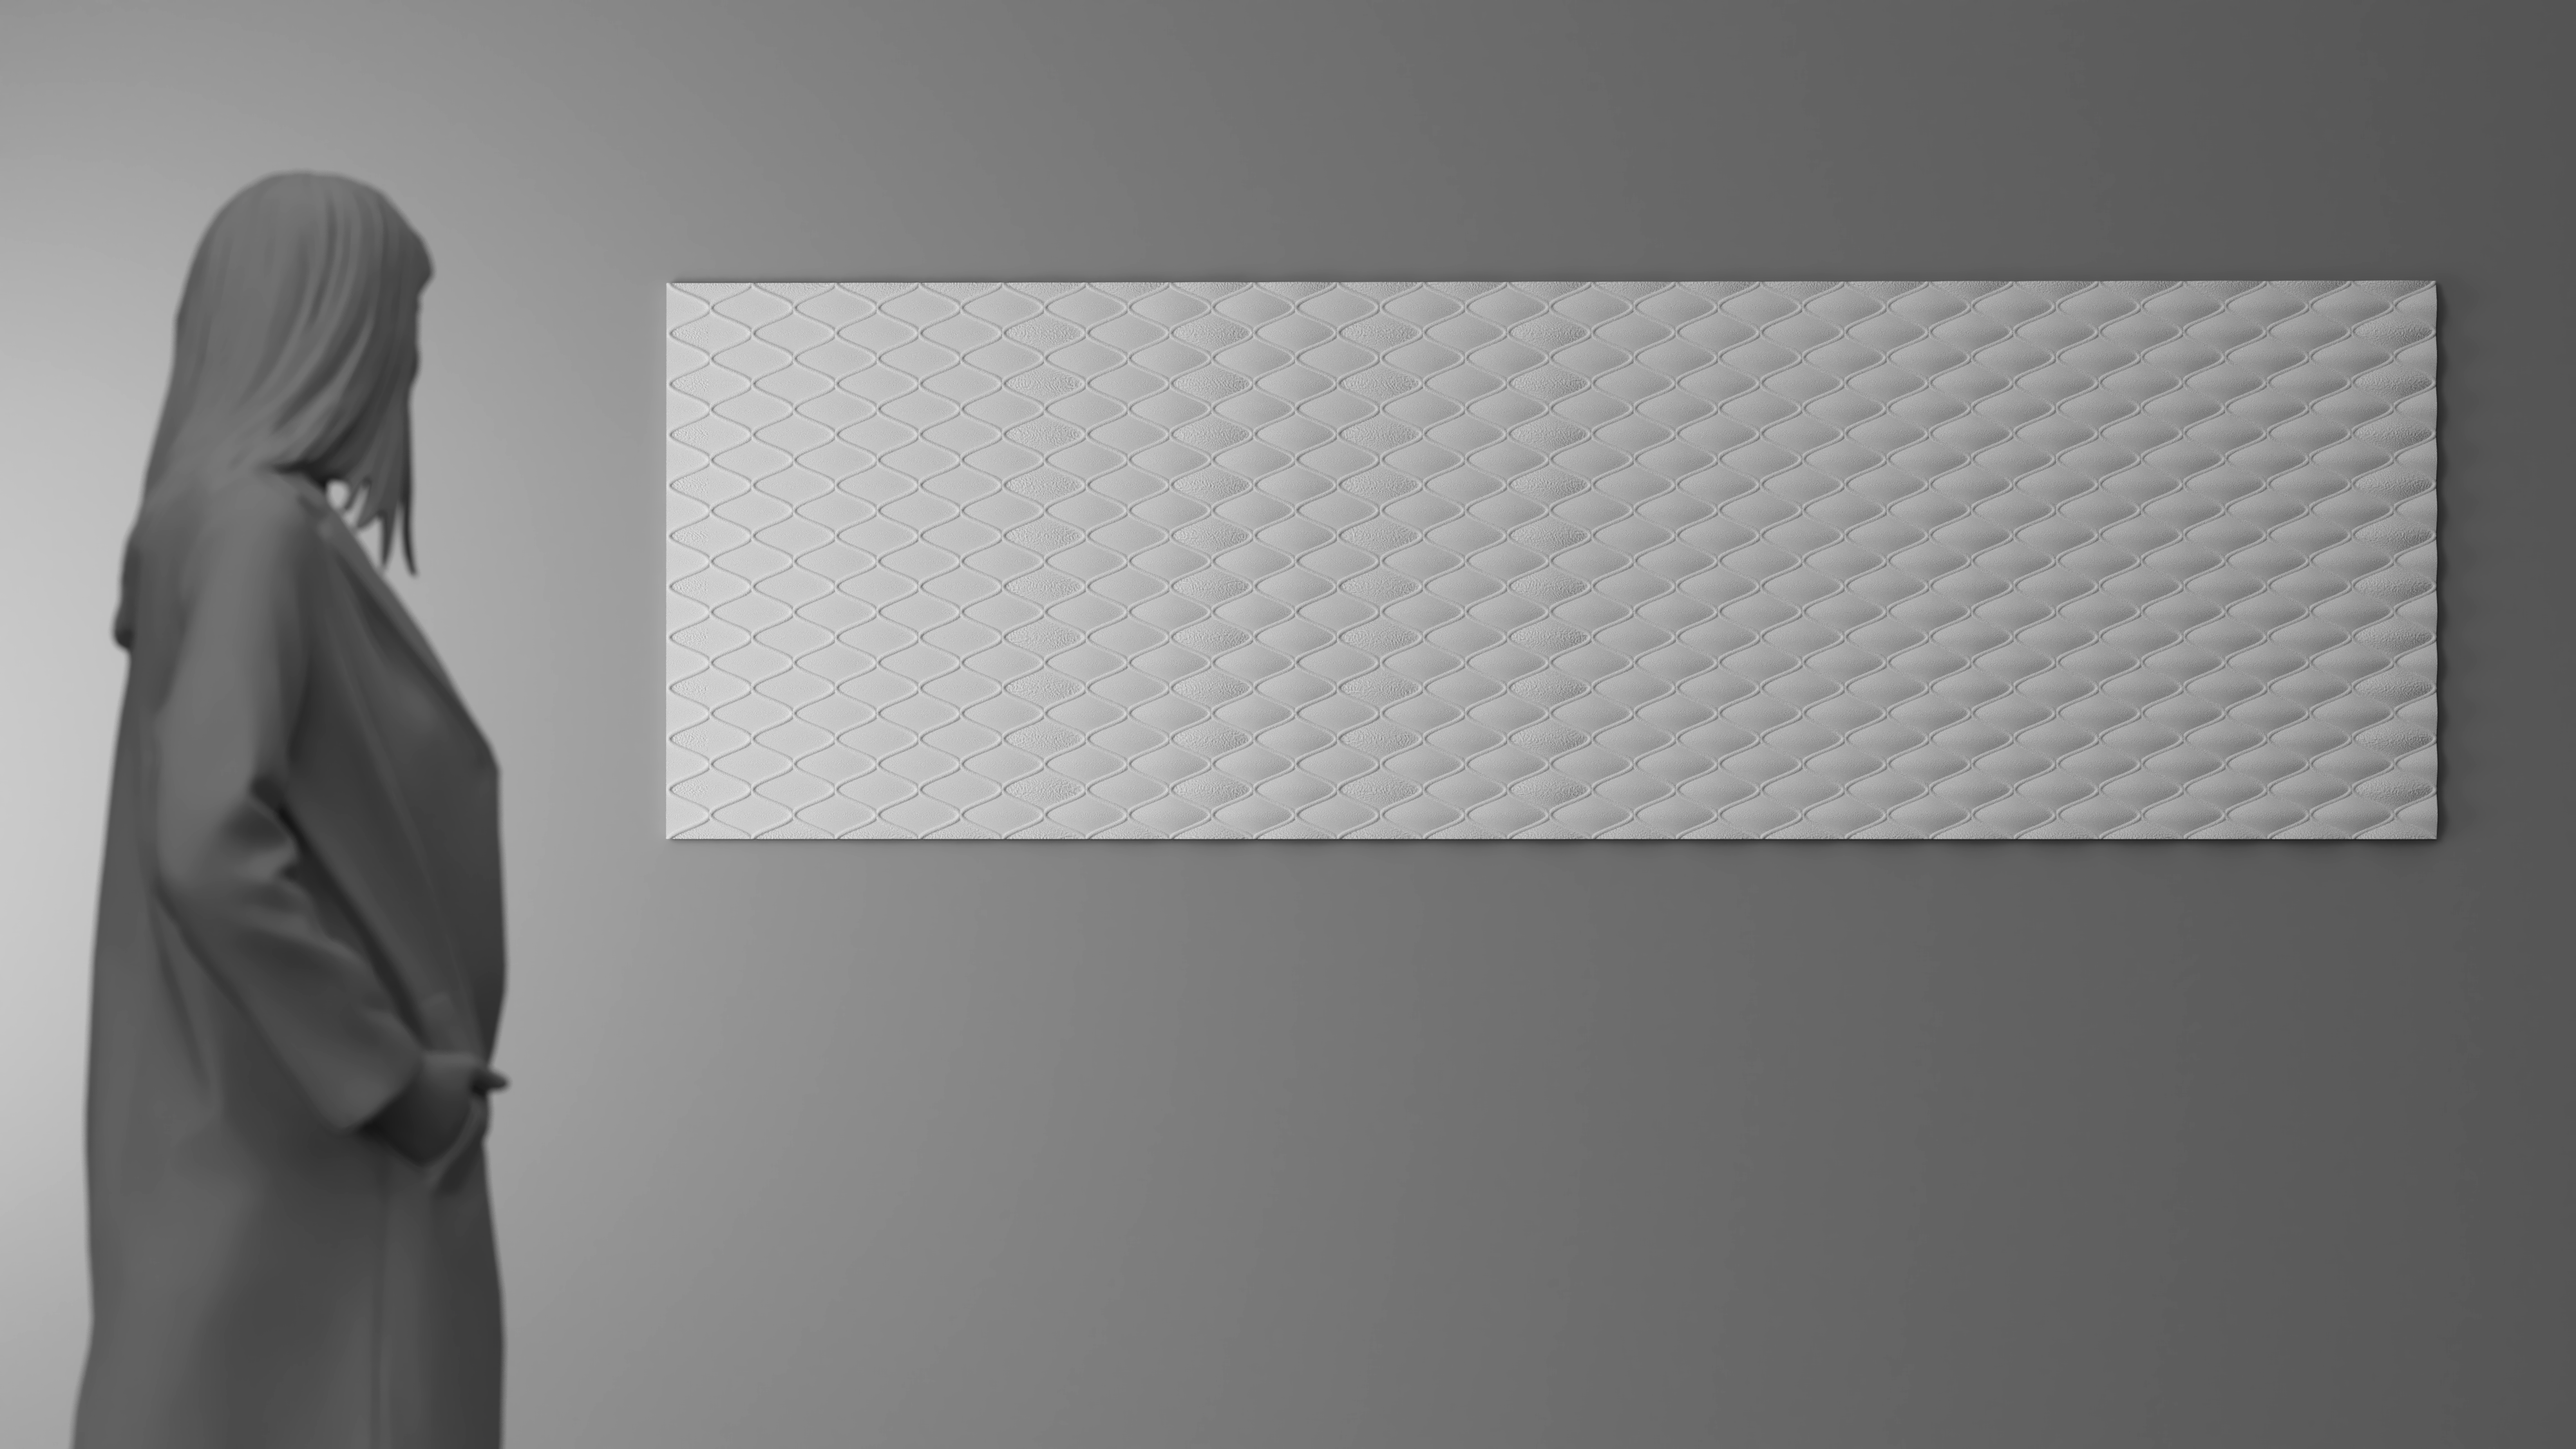
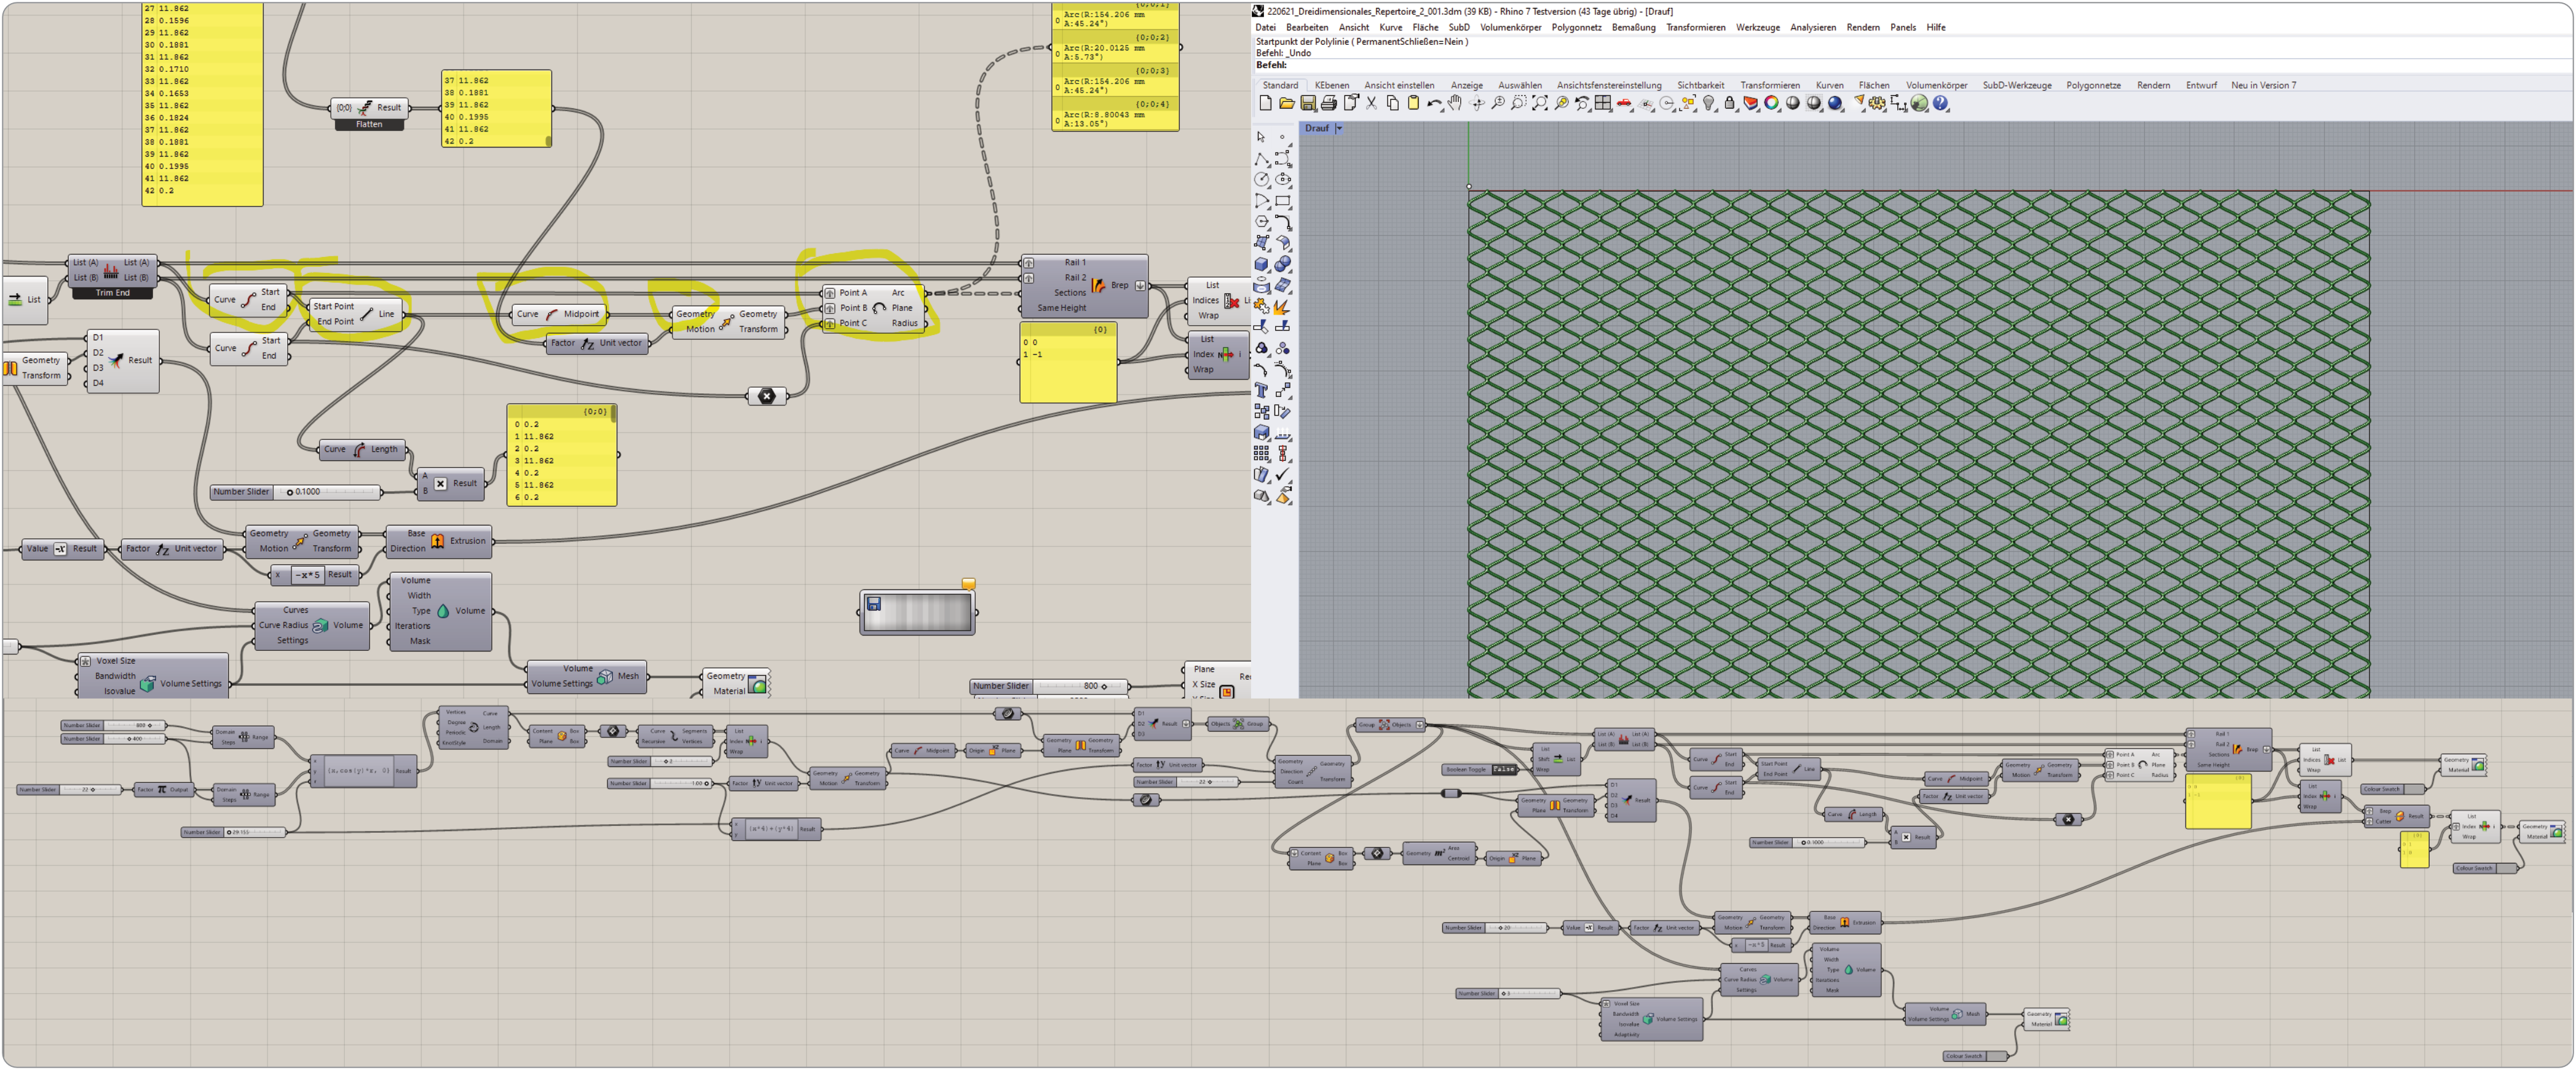
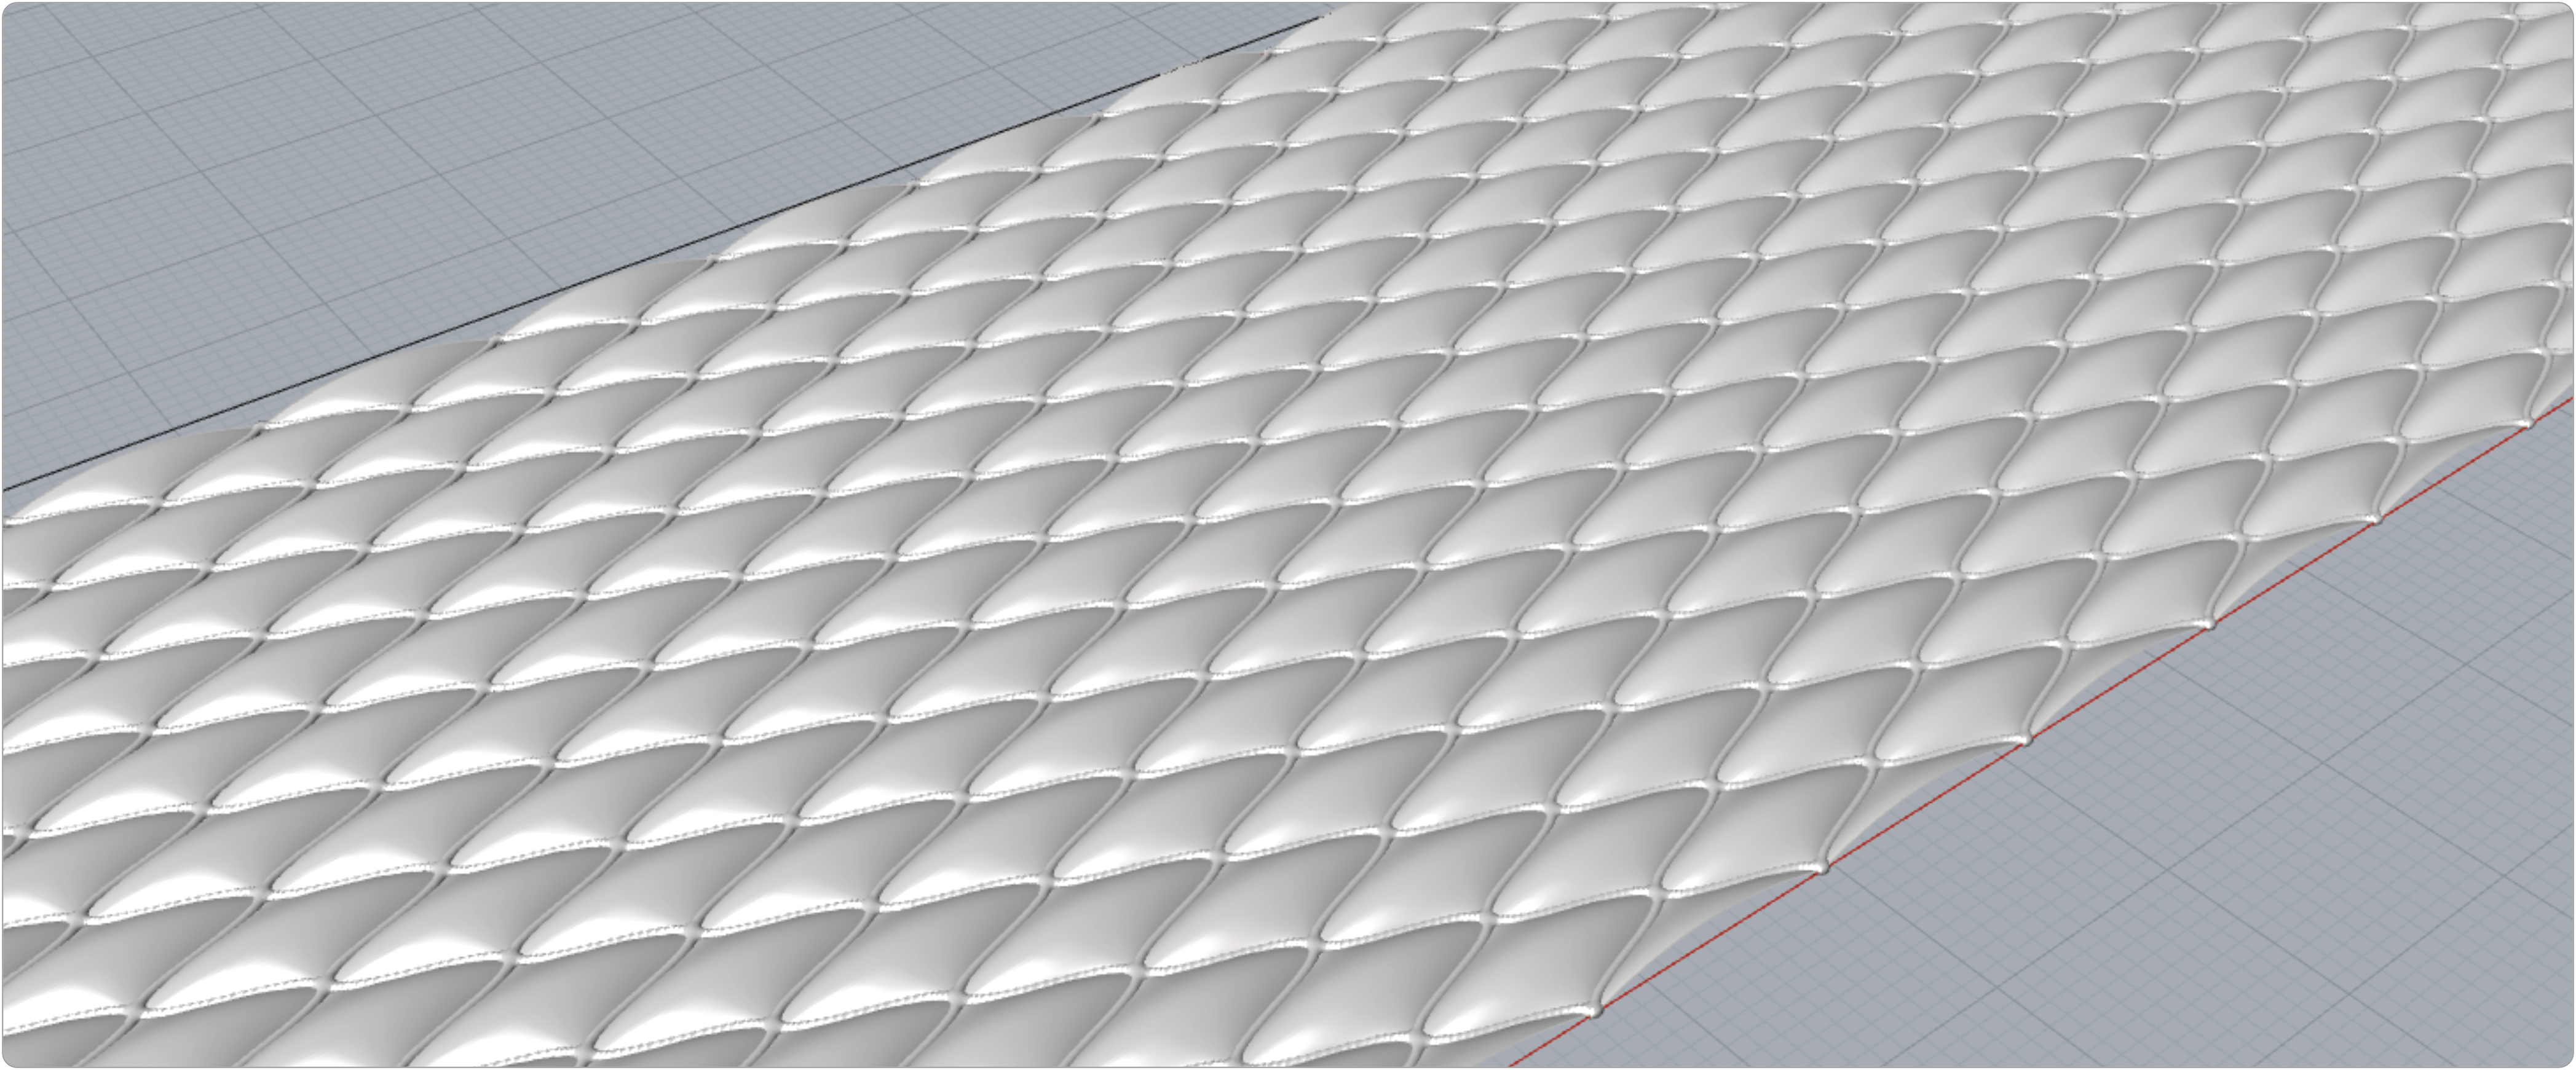
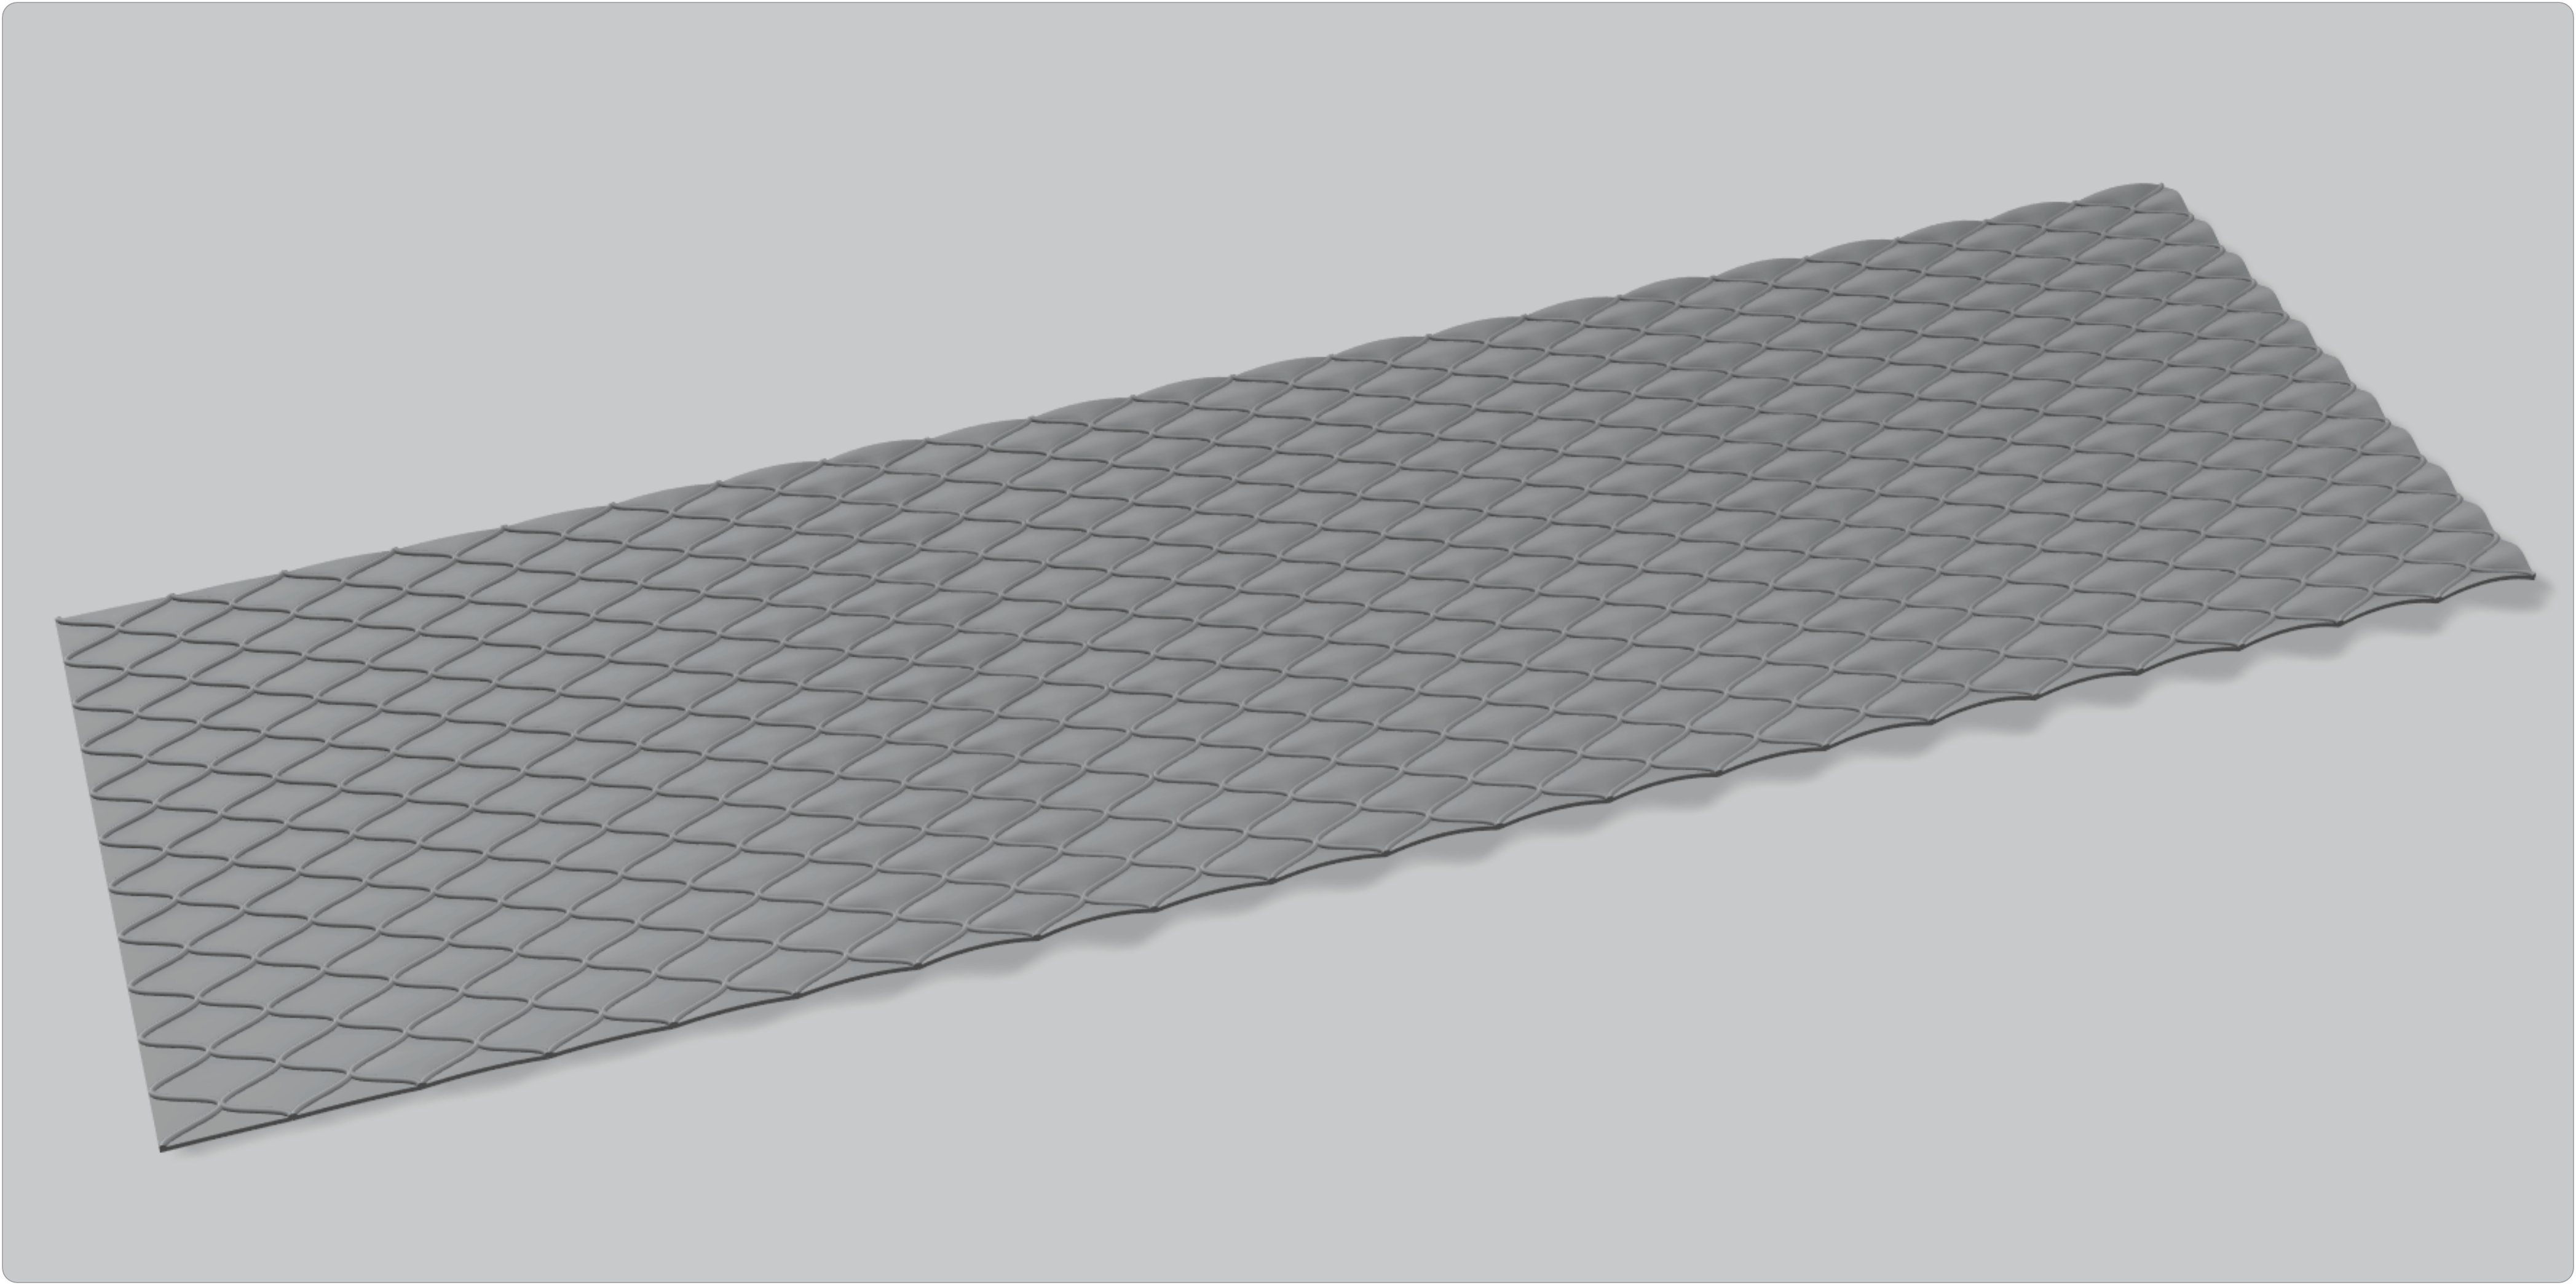
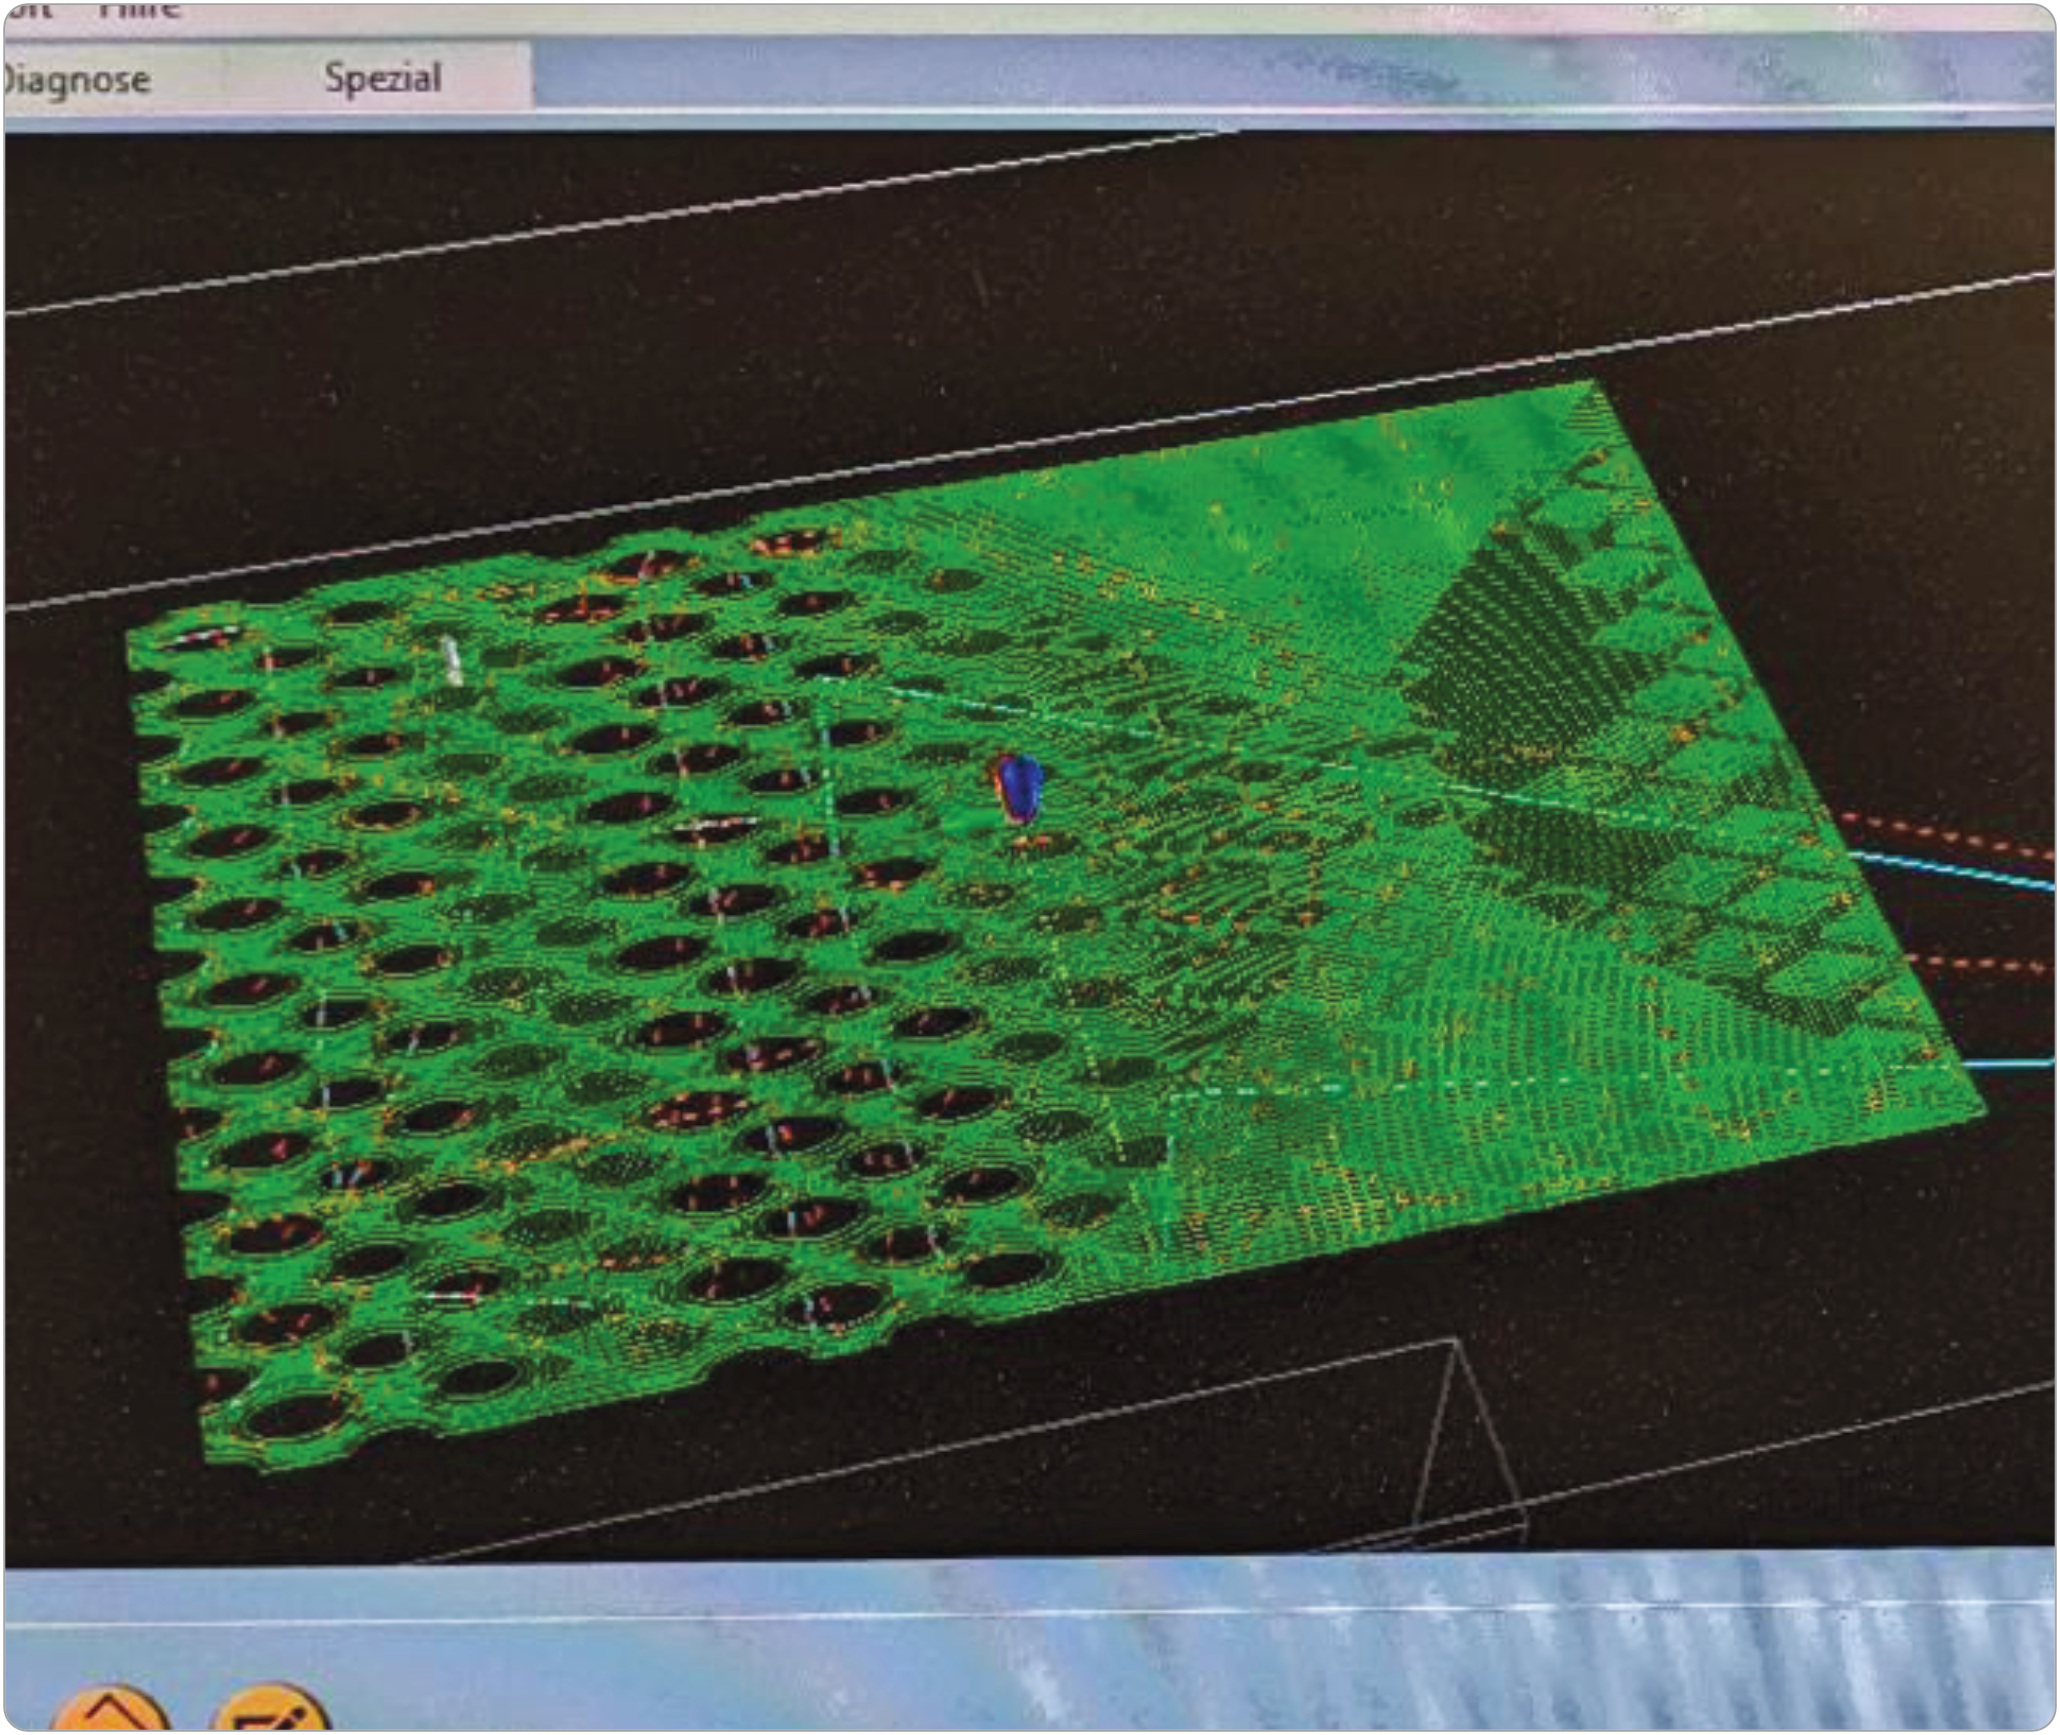
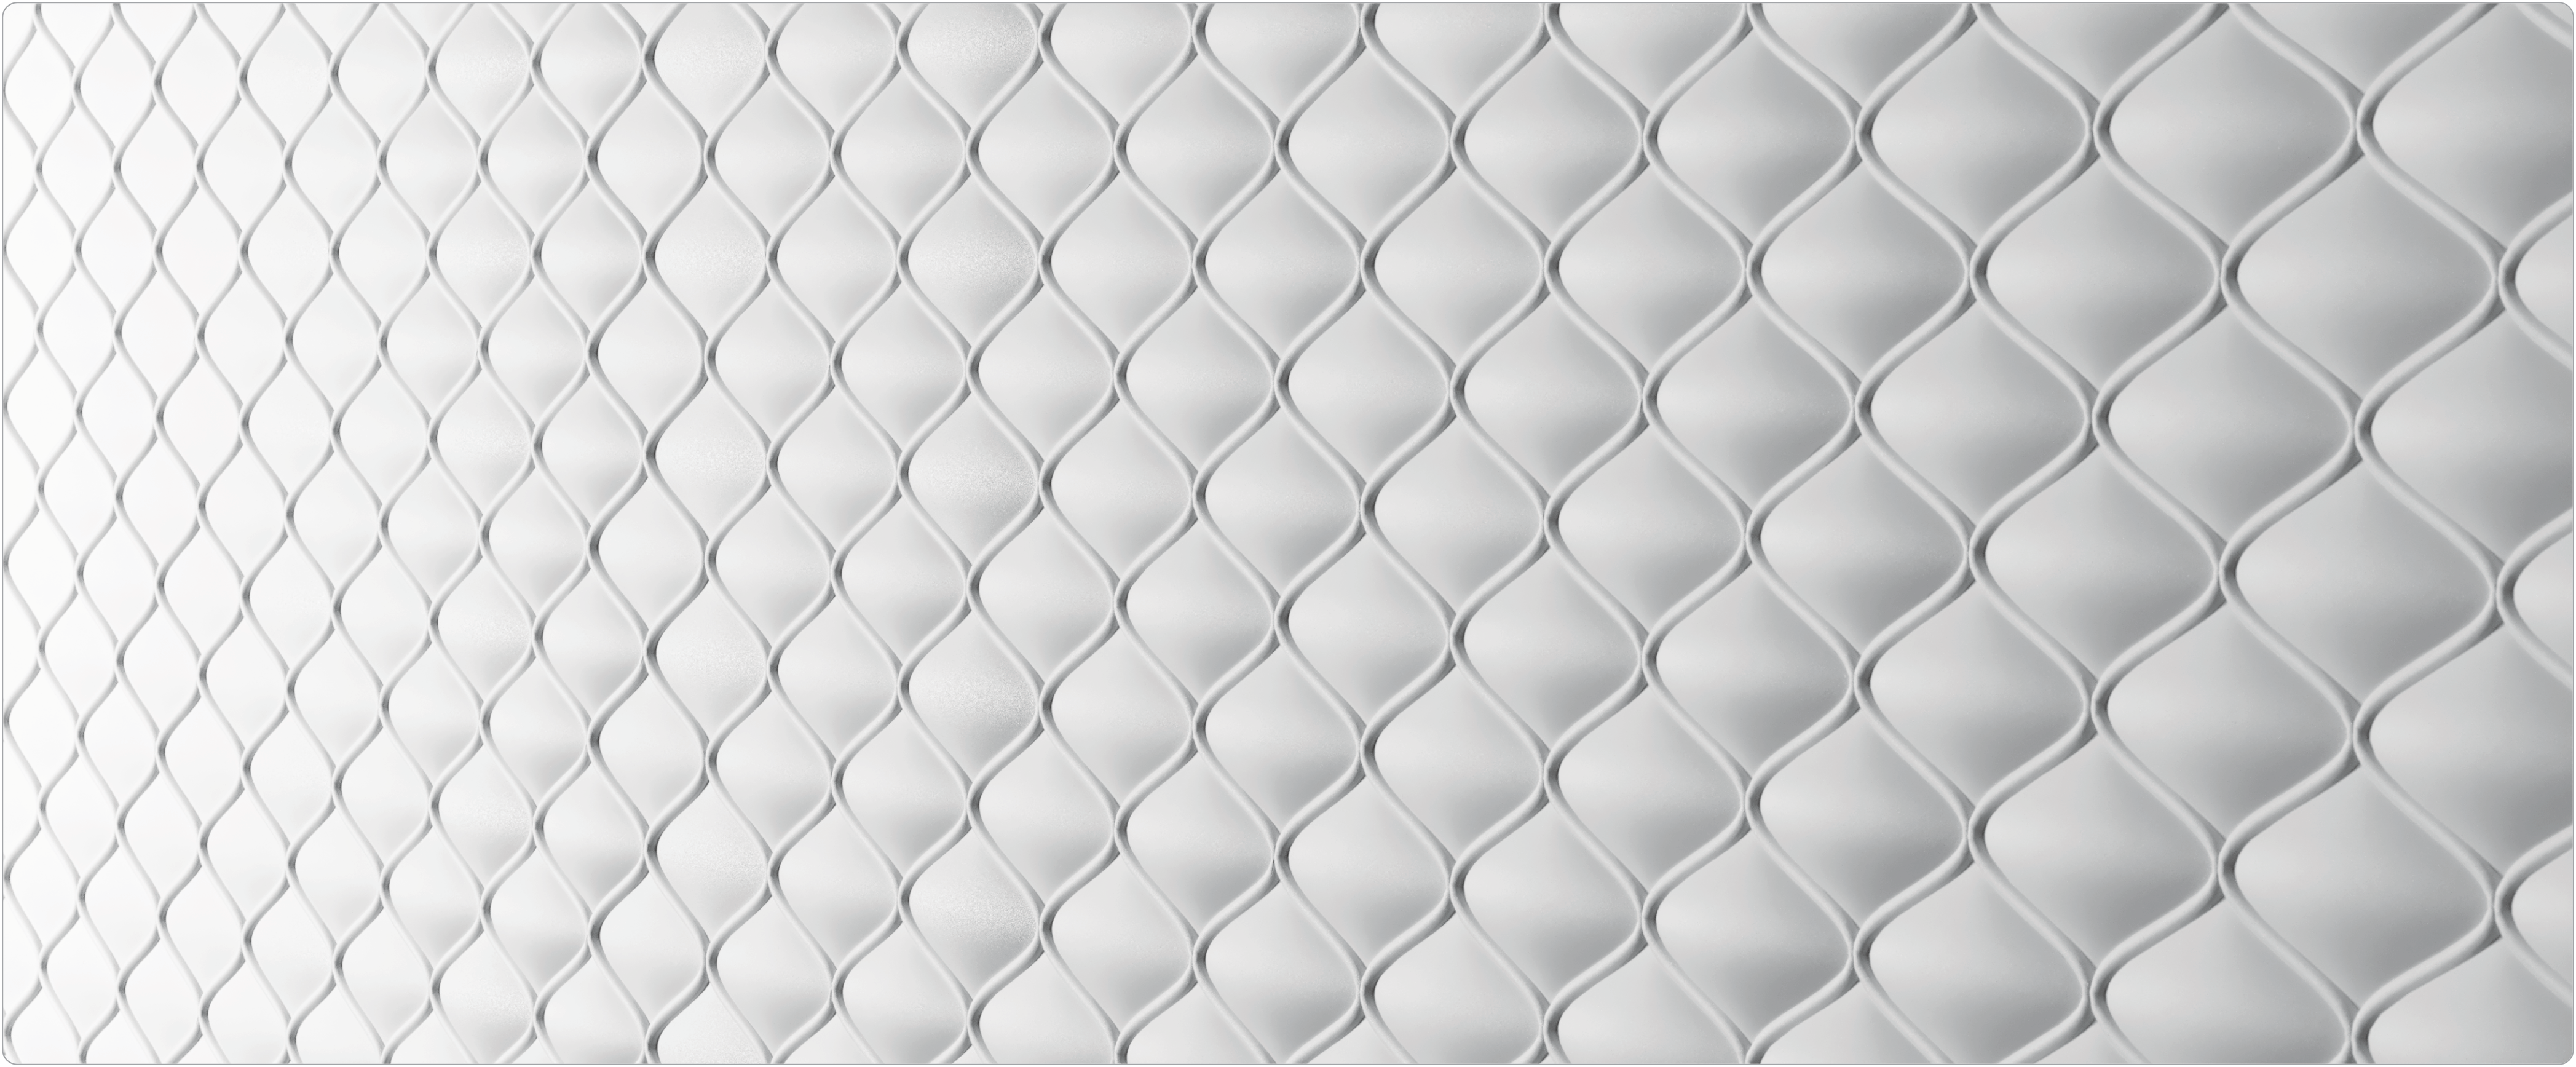
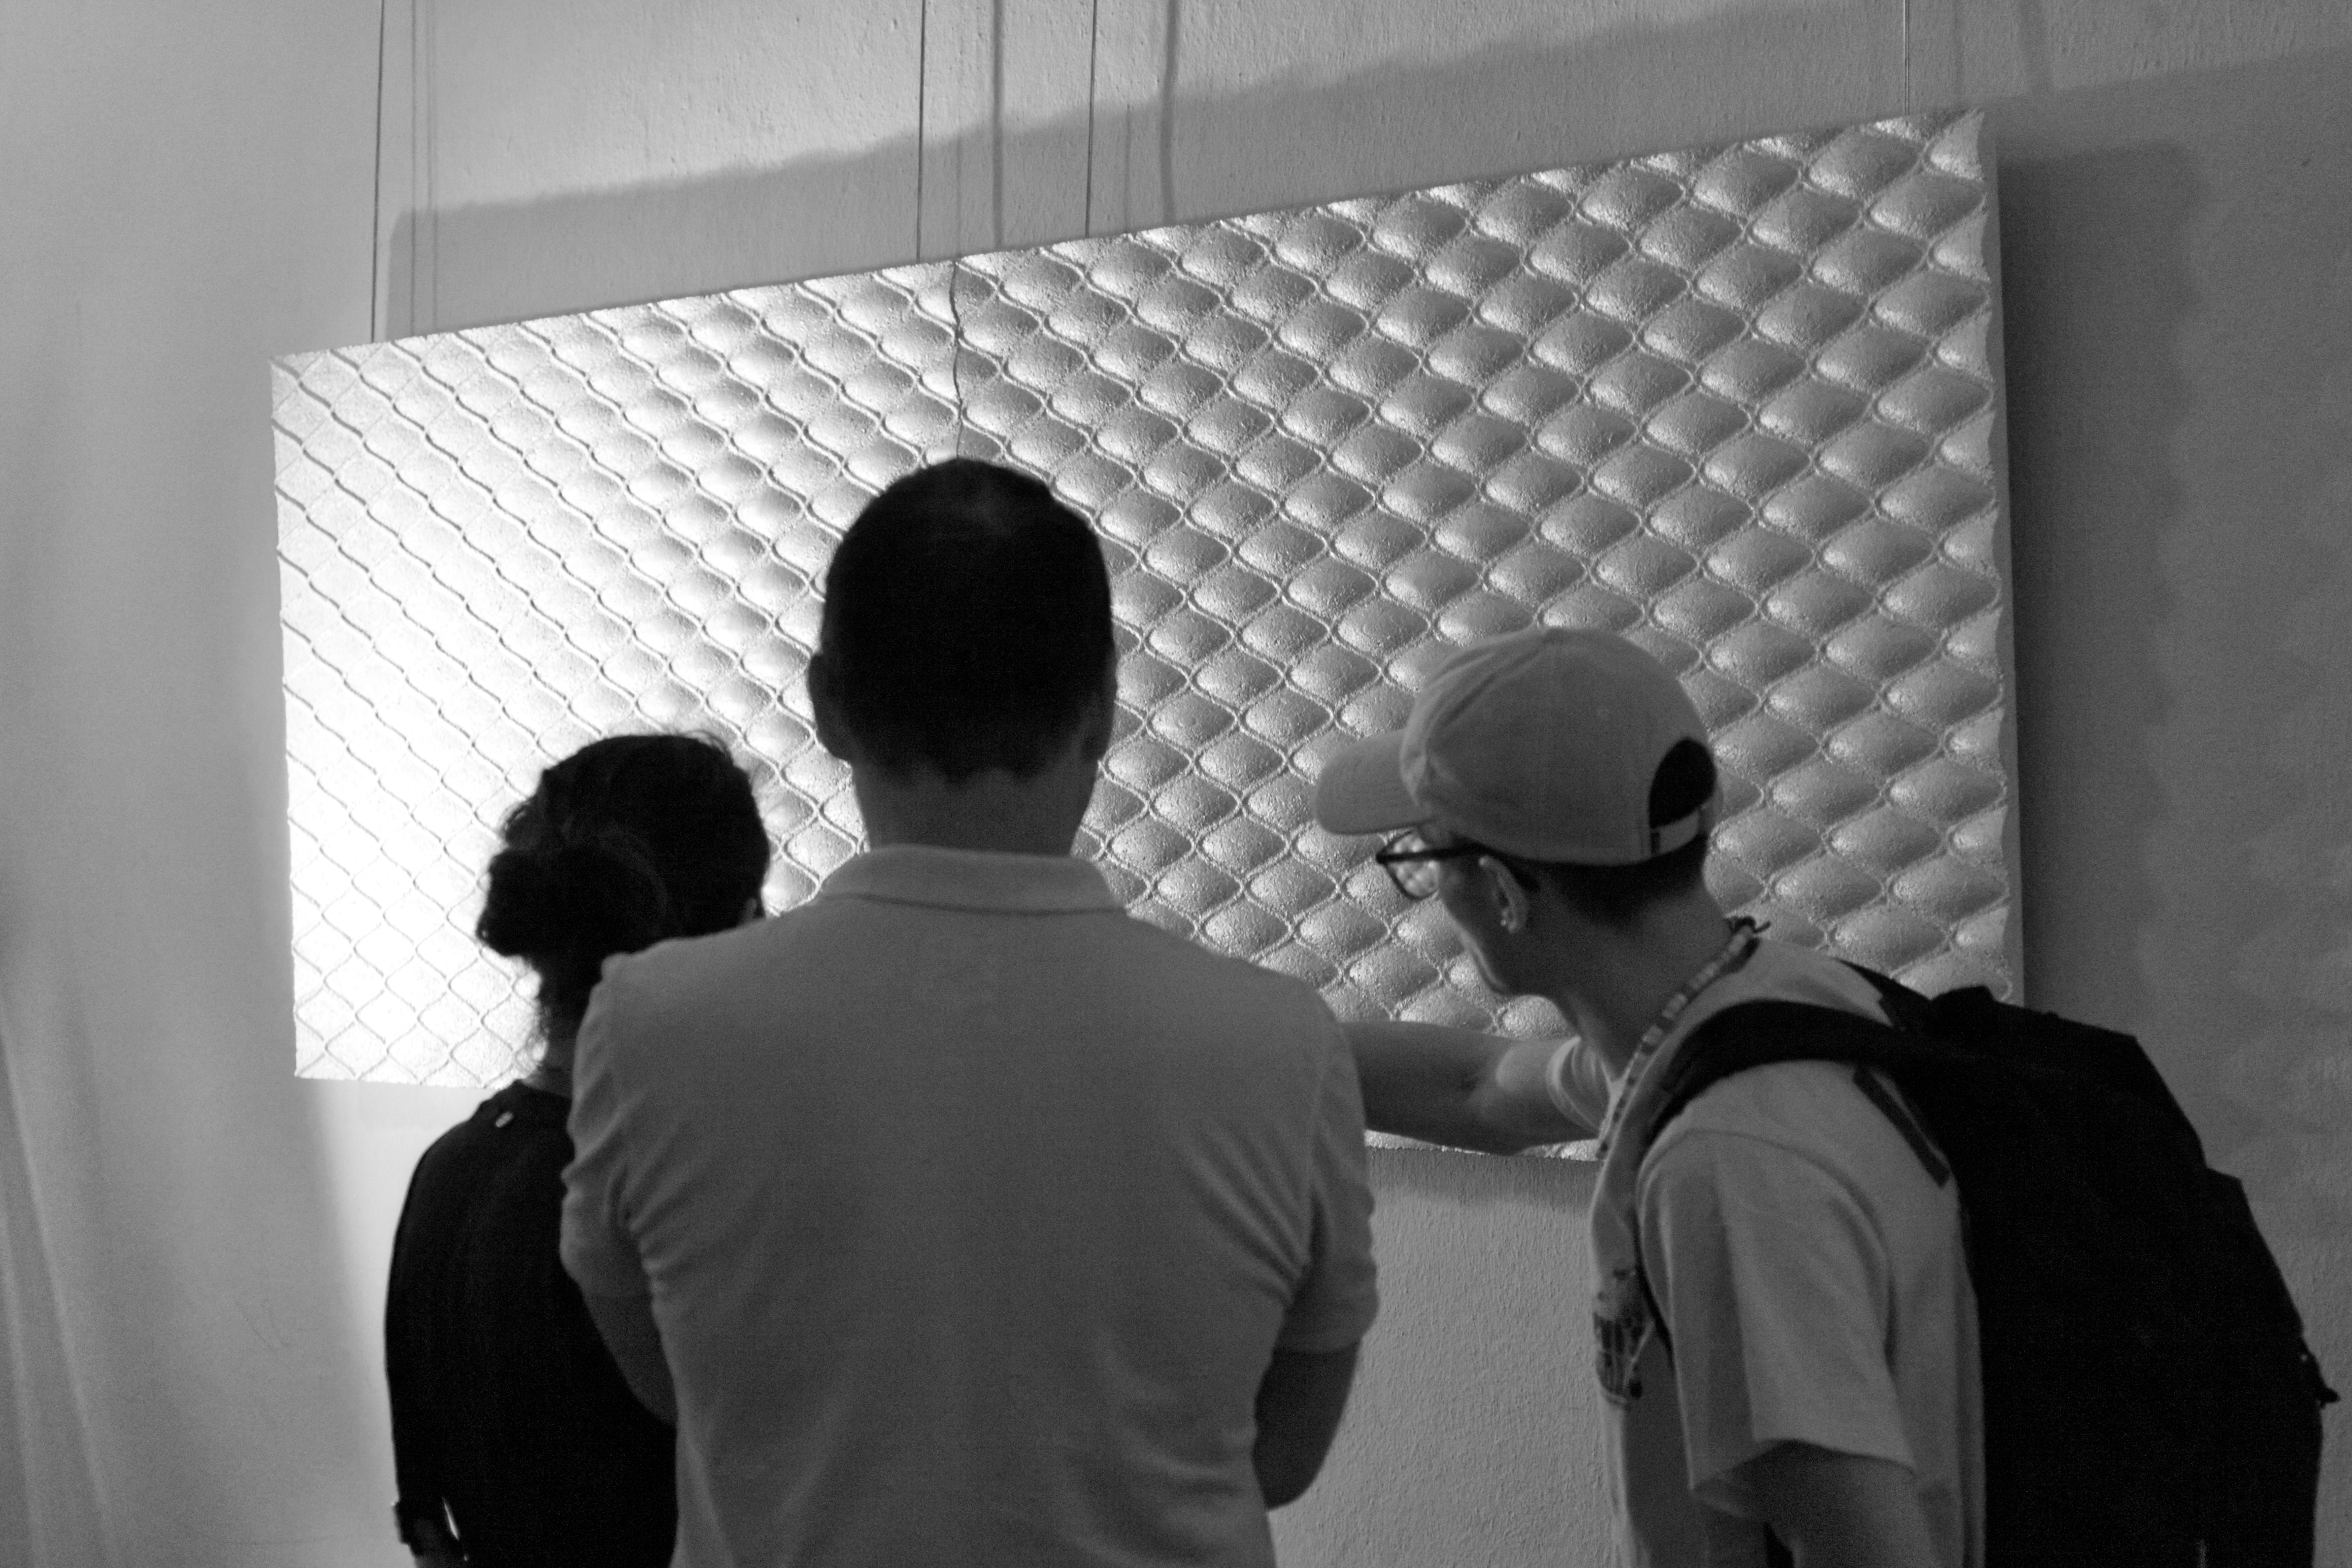
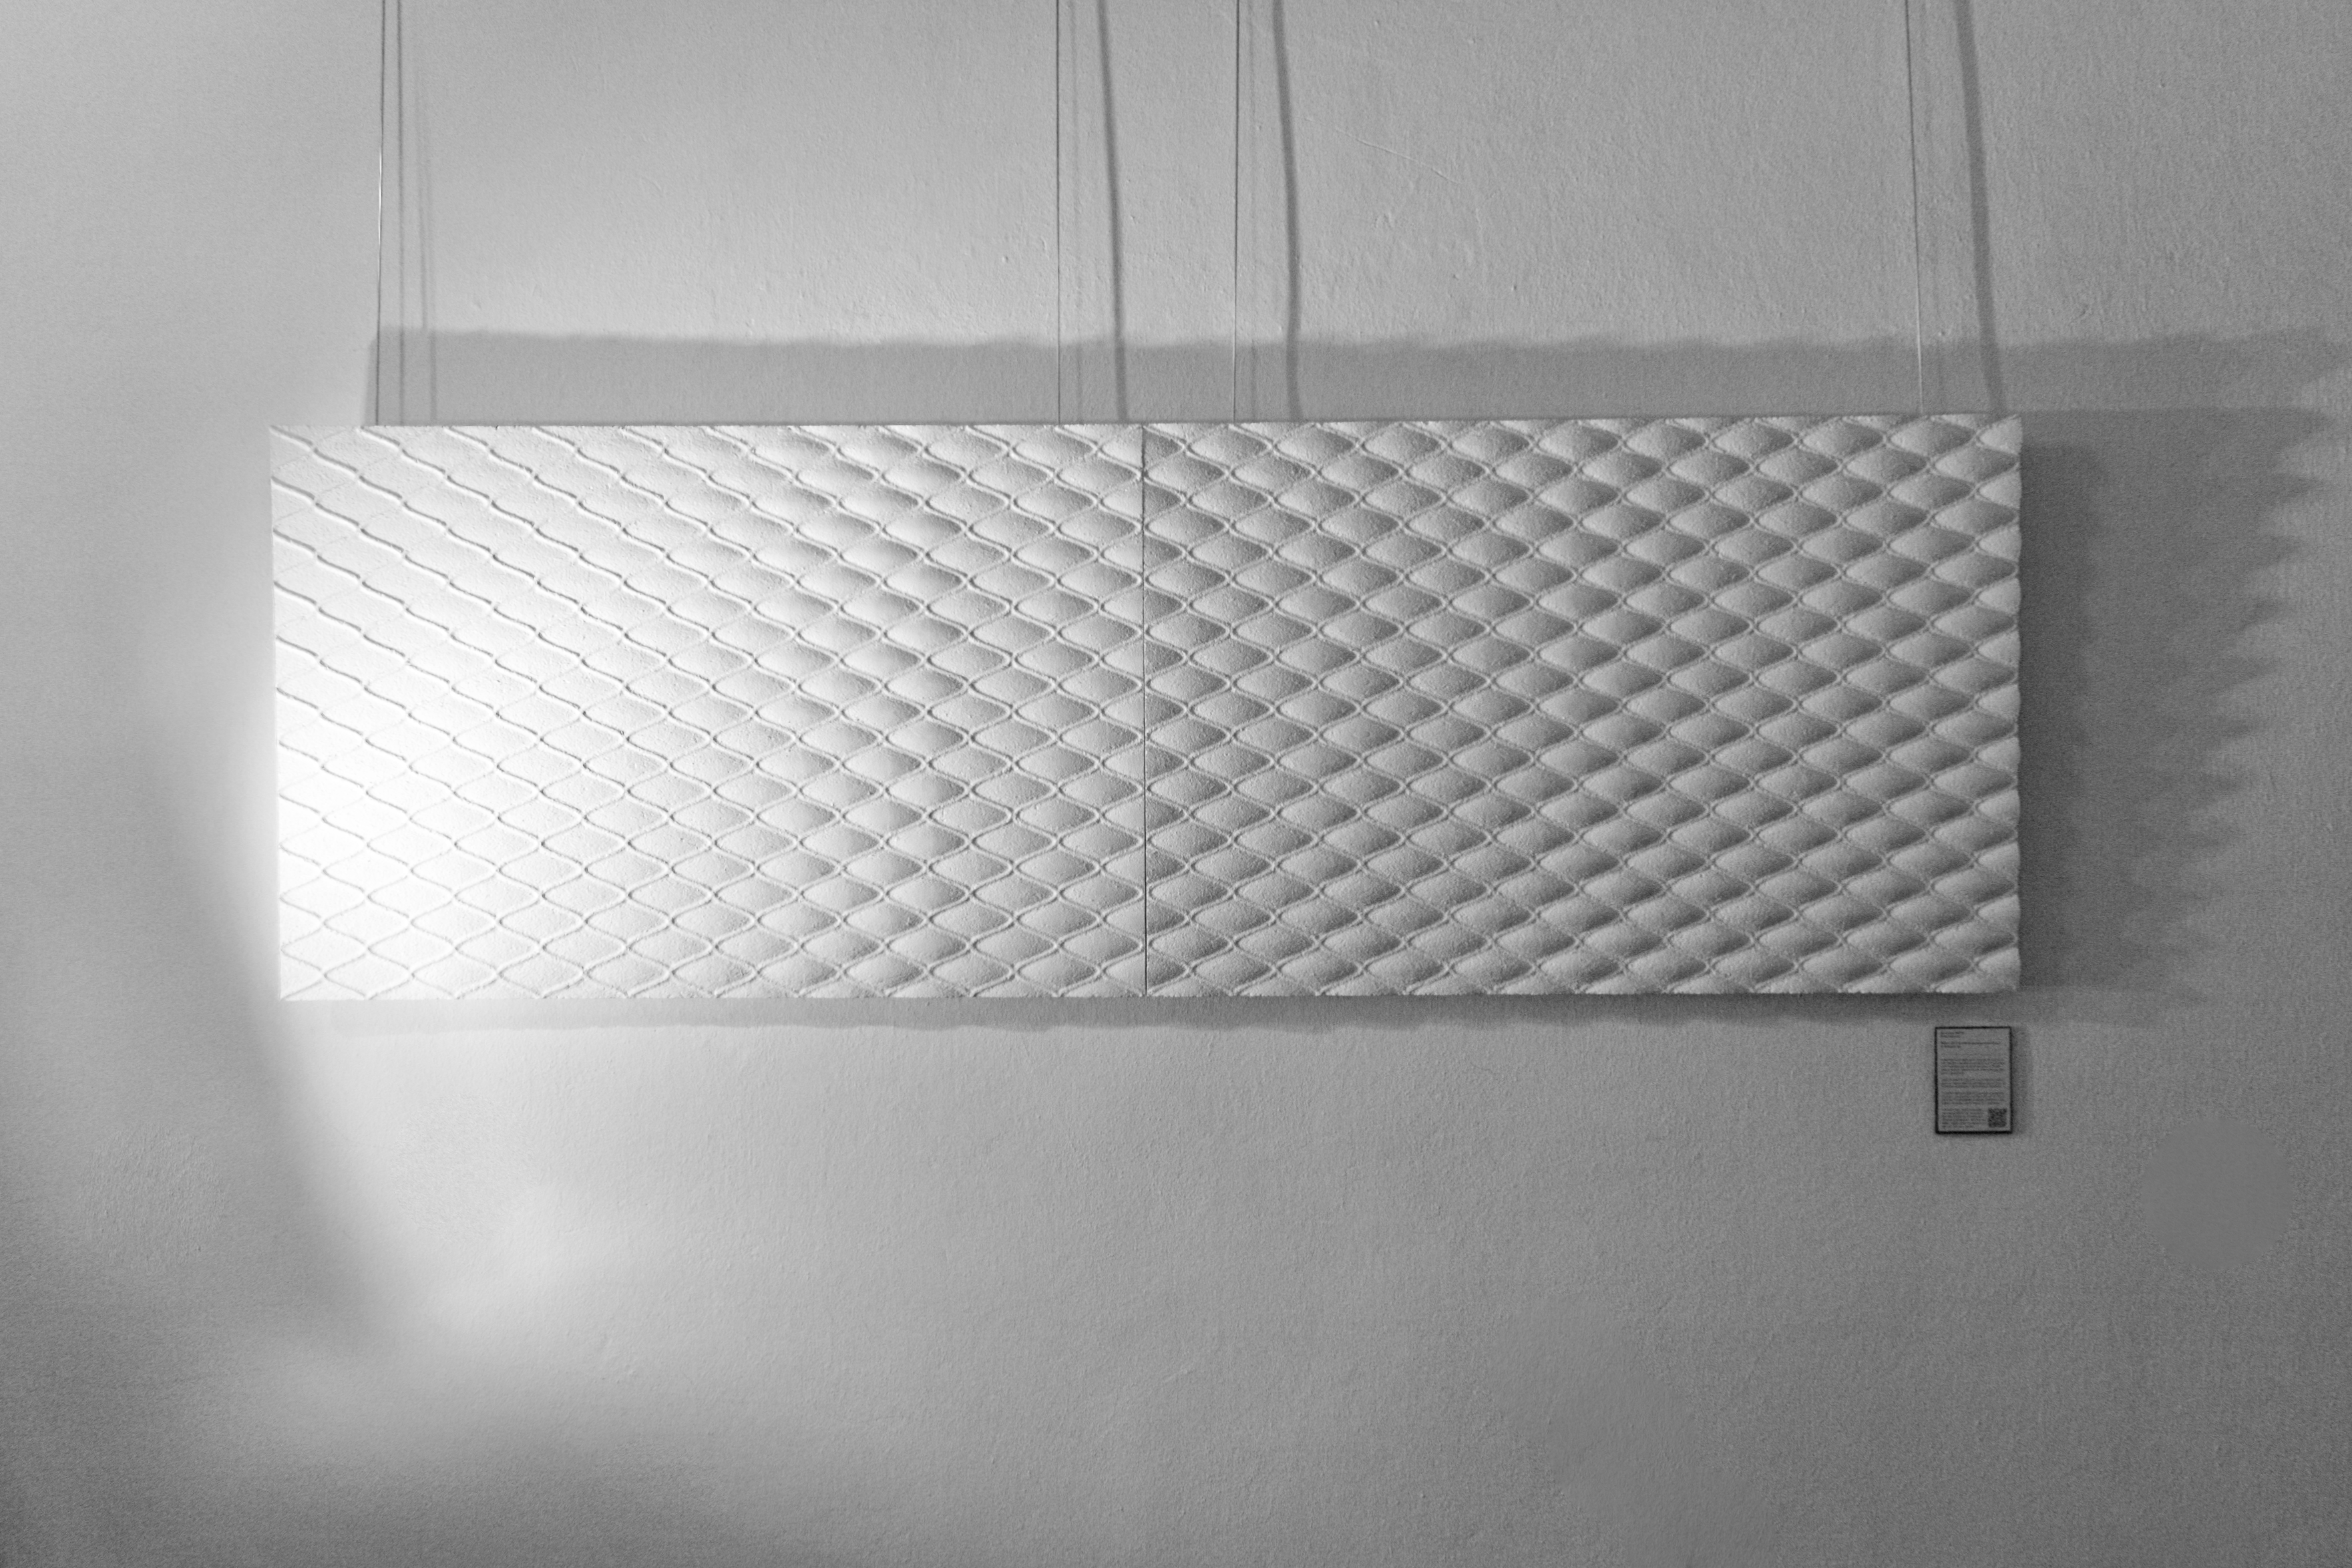
In the program Grasshopper, a plugin for Rhino7, a net-like structure was created, which should represent a fishing net. Between the ropes of the net, surfaces were spanned, whose expression is influenced by the individual values of the study.
The same subdivision found in the study figure is thus also found on the three-dimensional object.
The more fishing has been done, the fuller the nets are. You can see a progression from left to right as the net gets fuller and fuller.
One could also formulate the statement as „The more fishing, the more serious the impact on nature and fish stocks.“
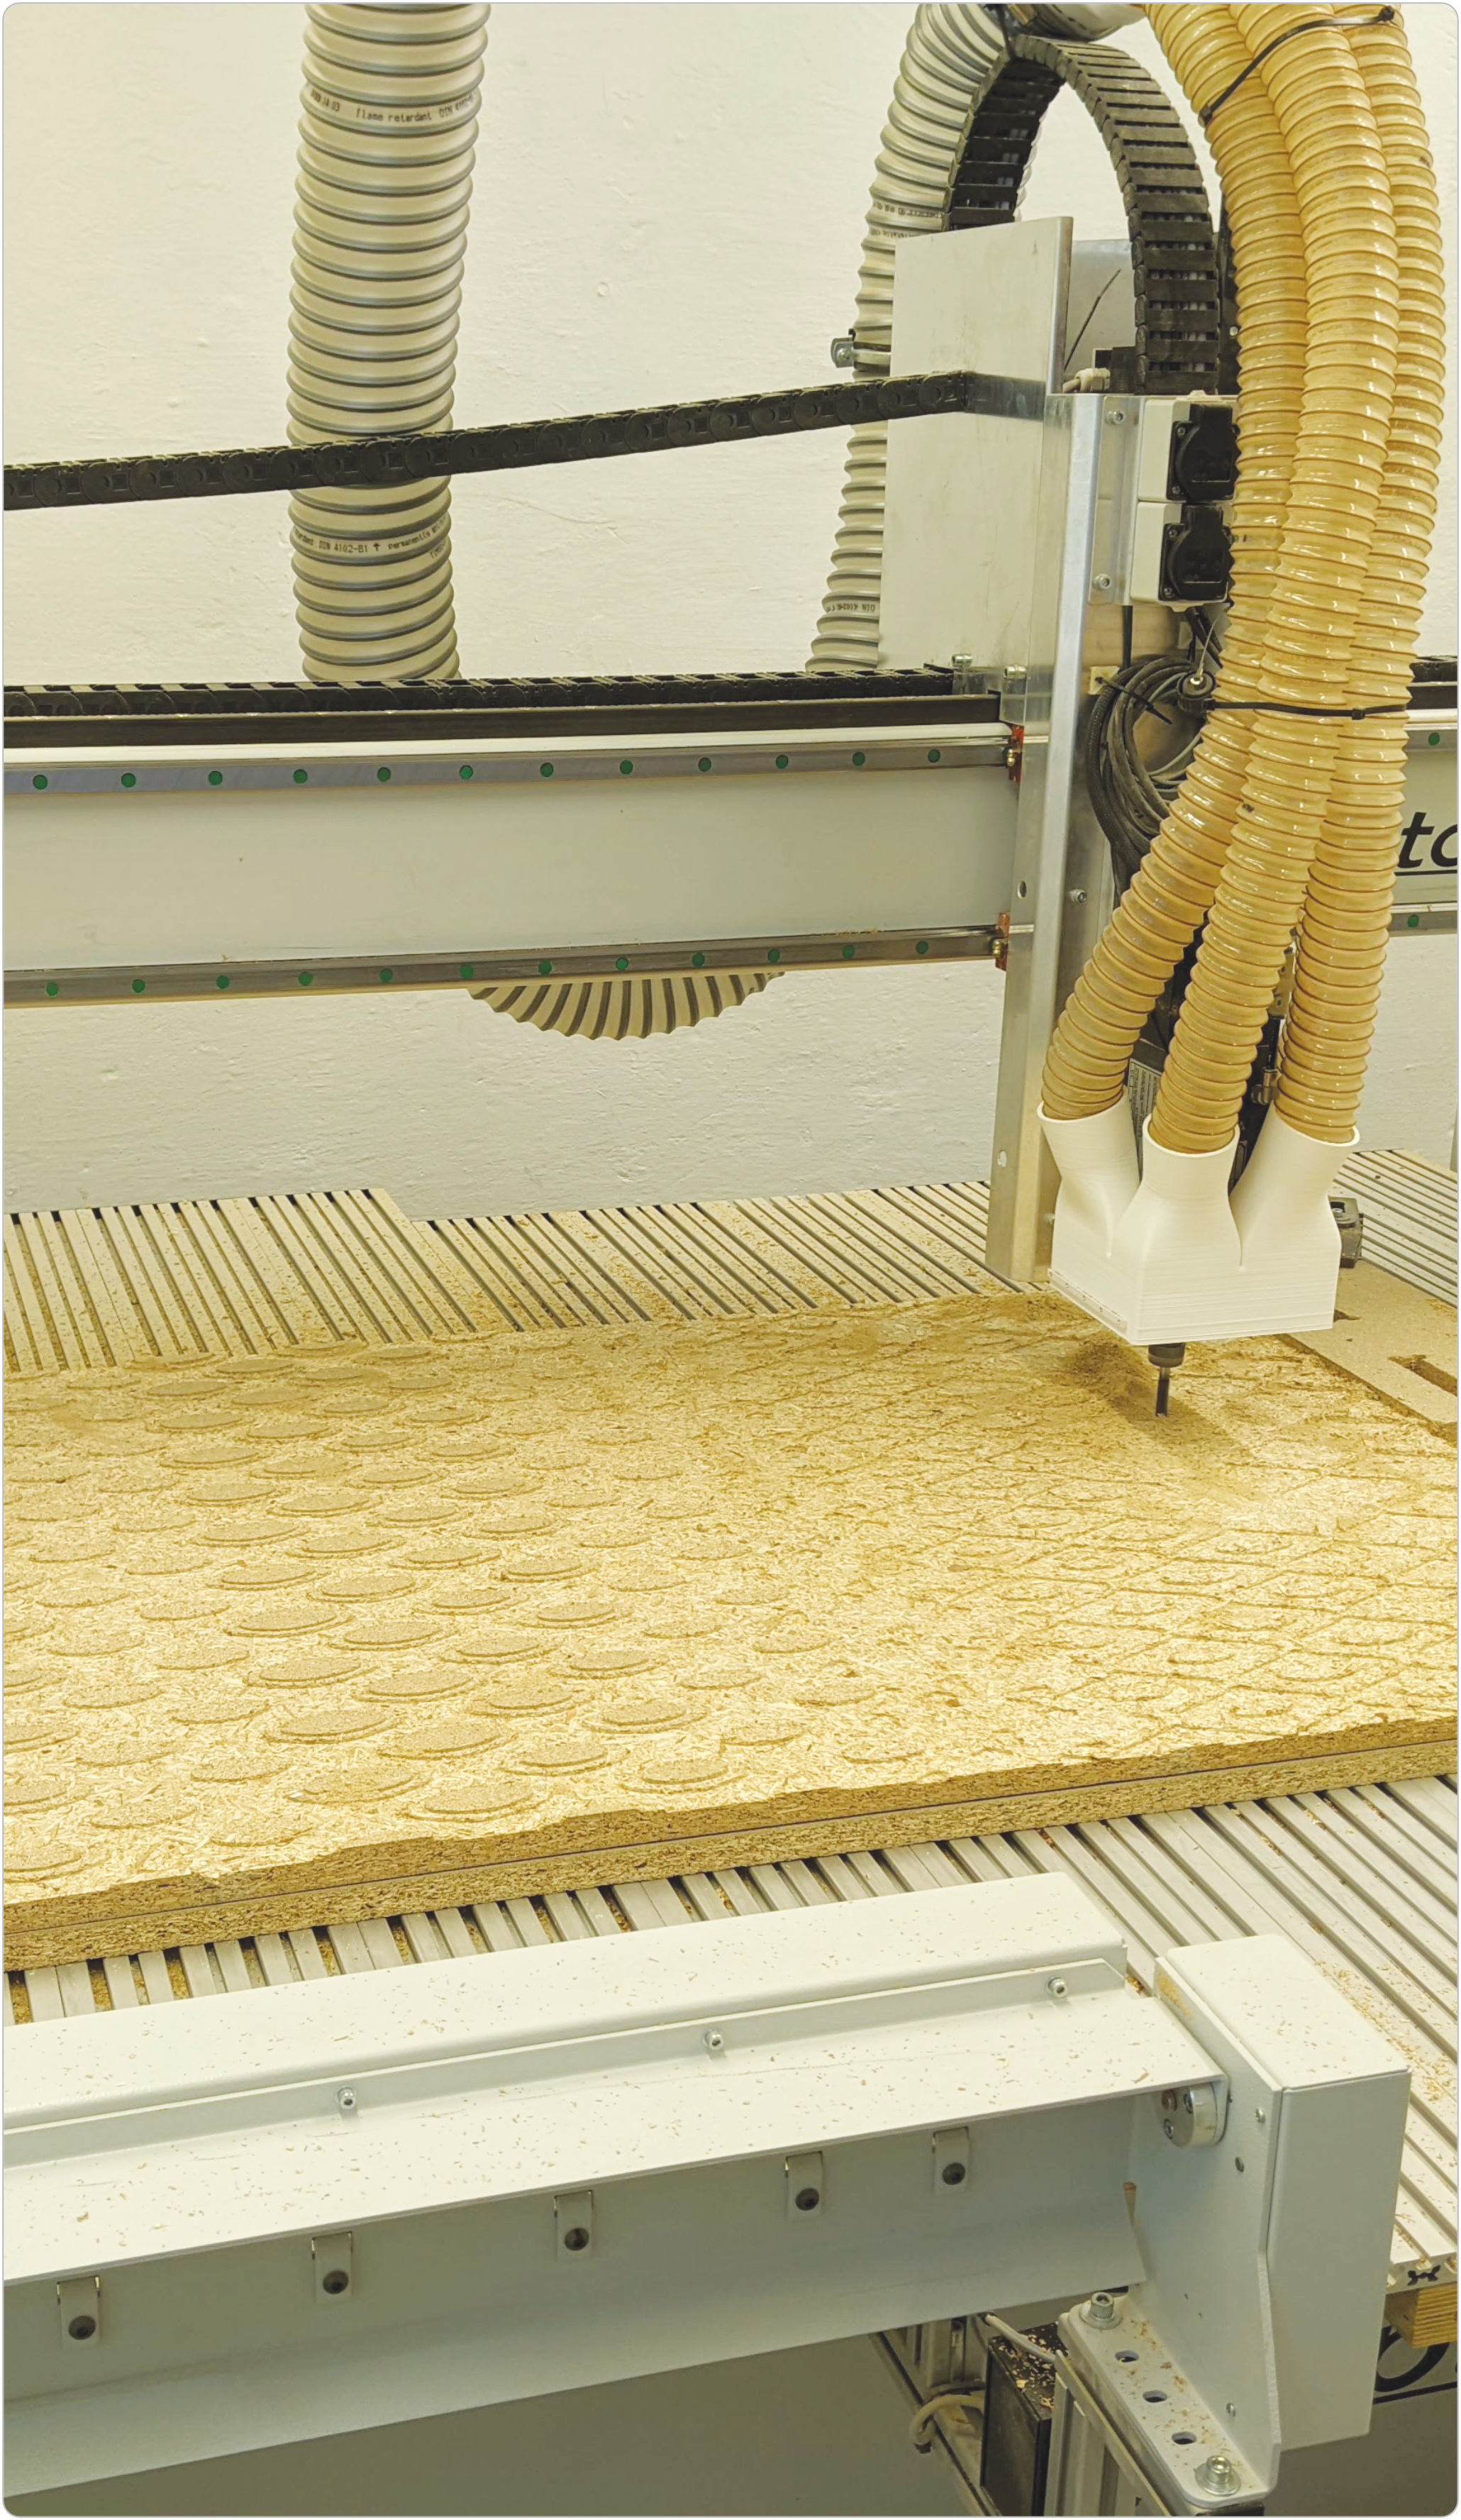
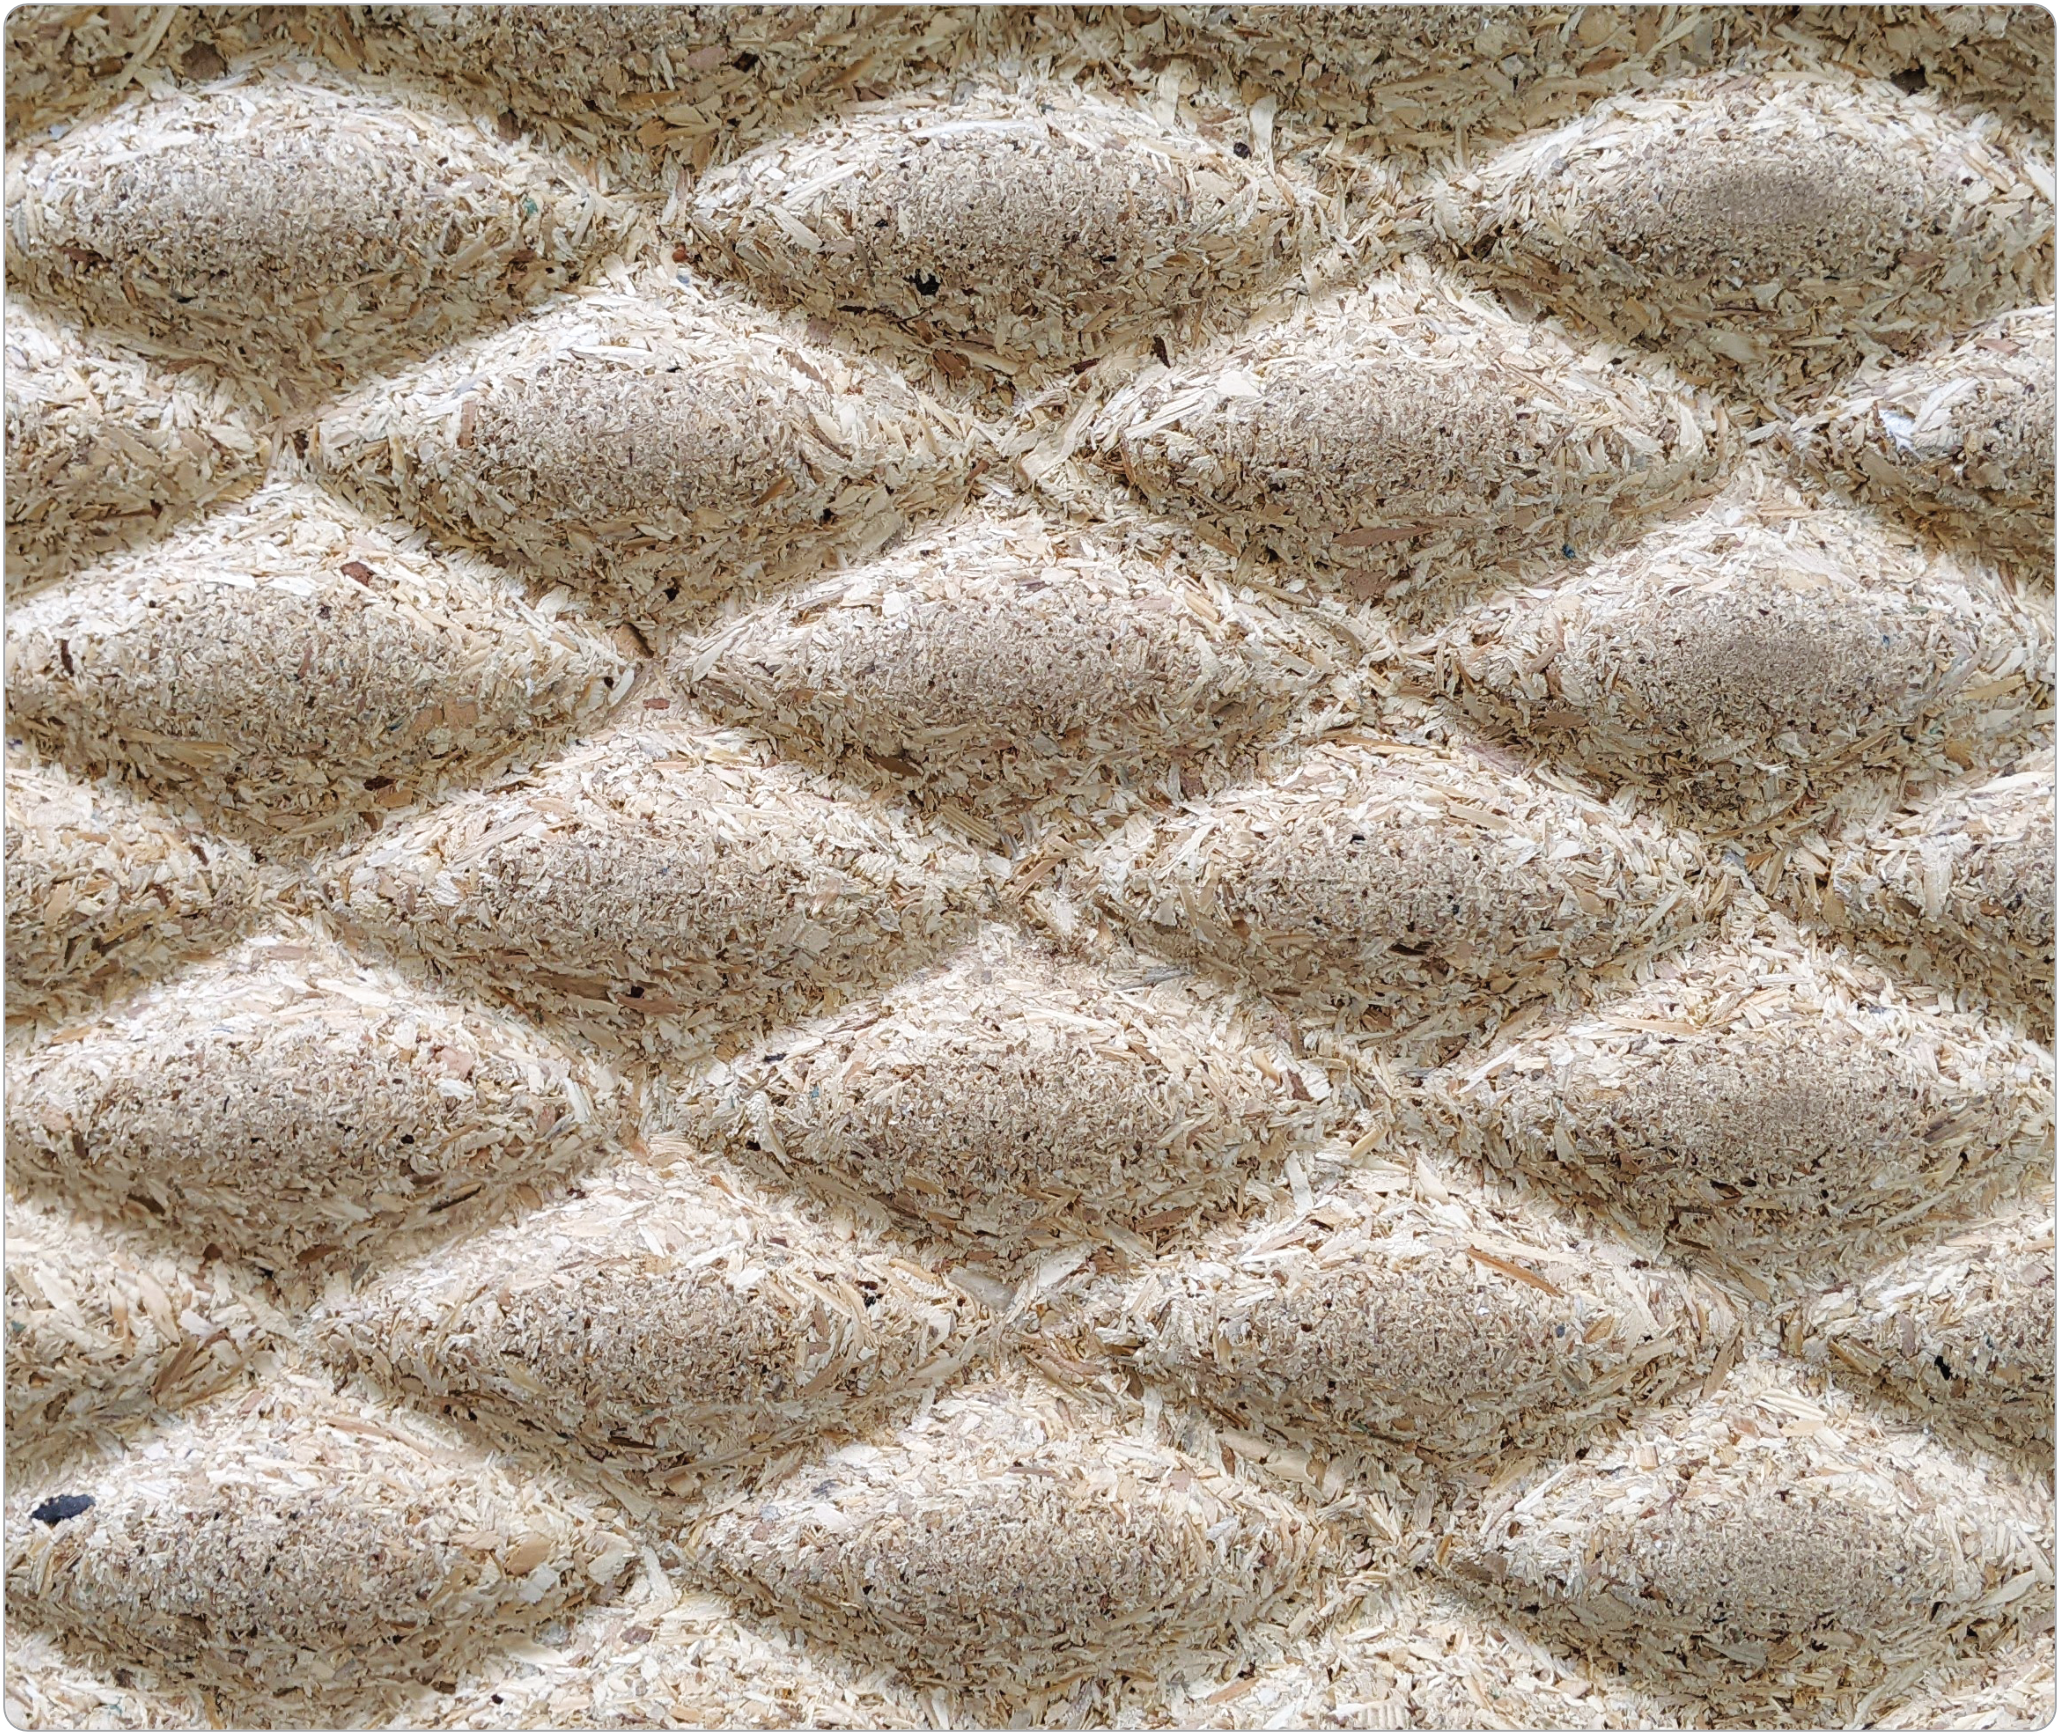
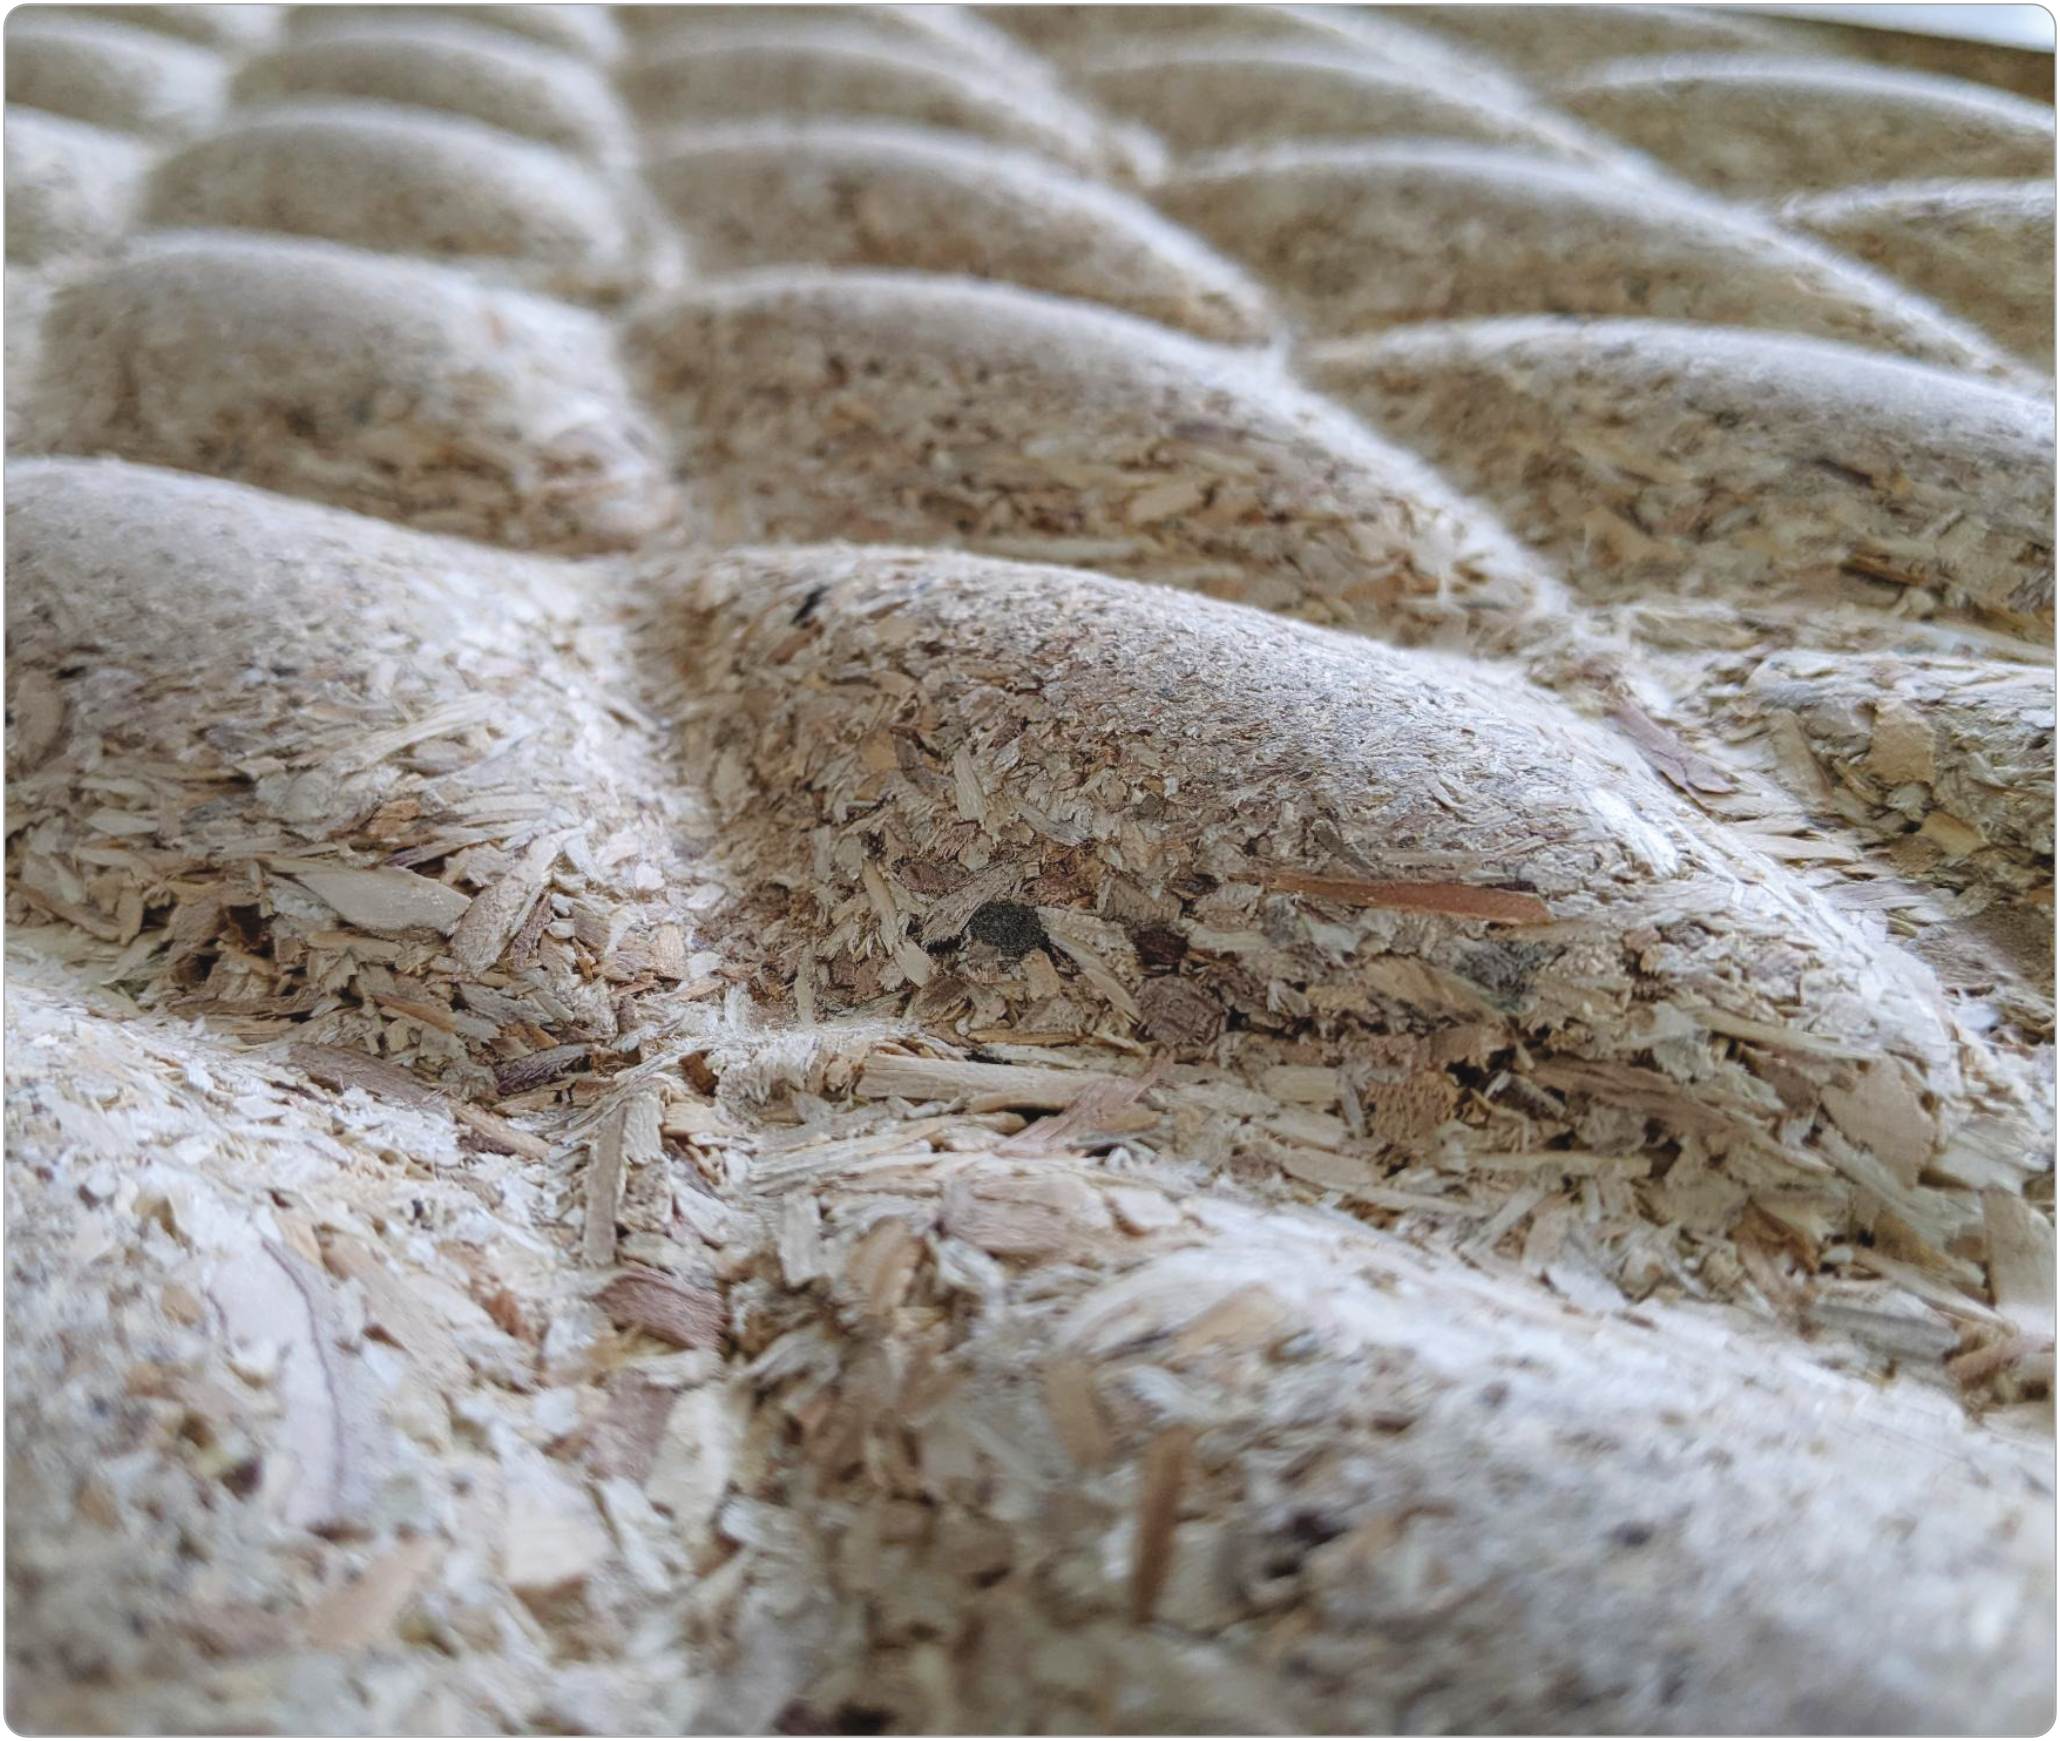
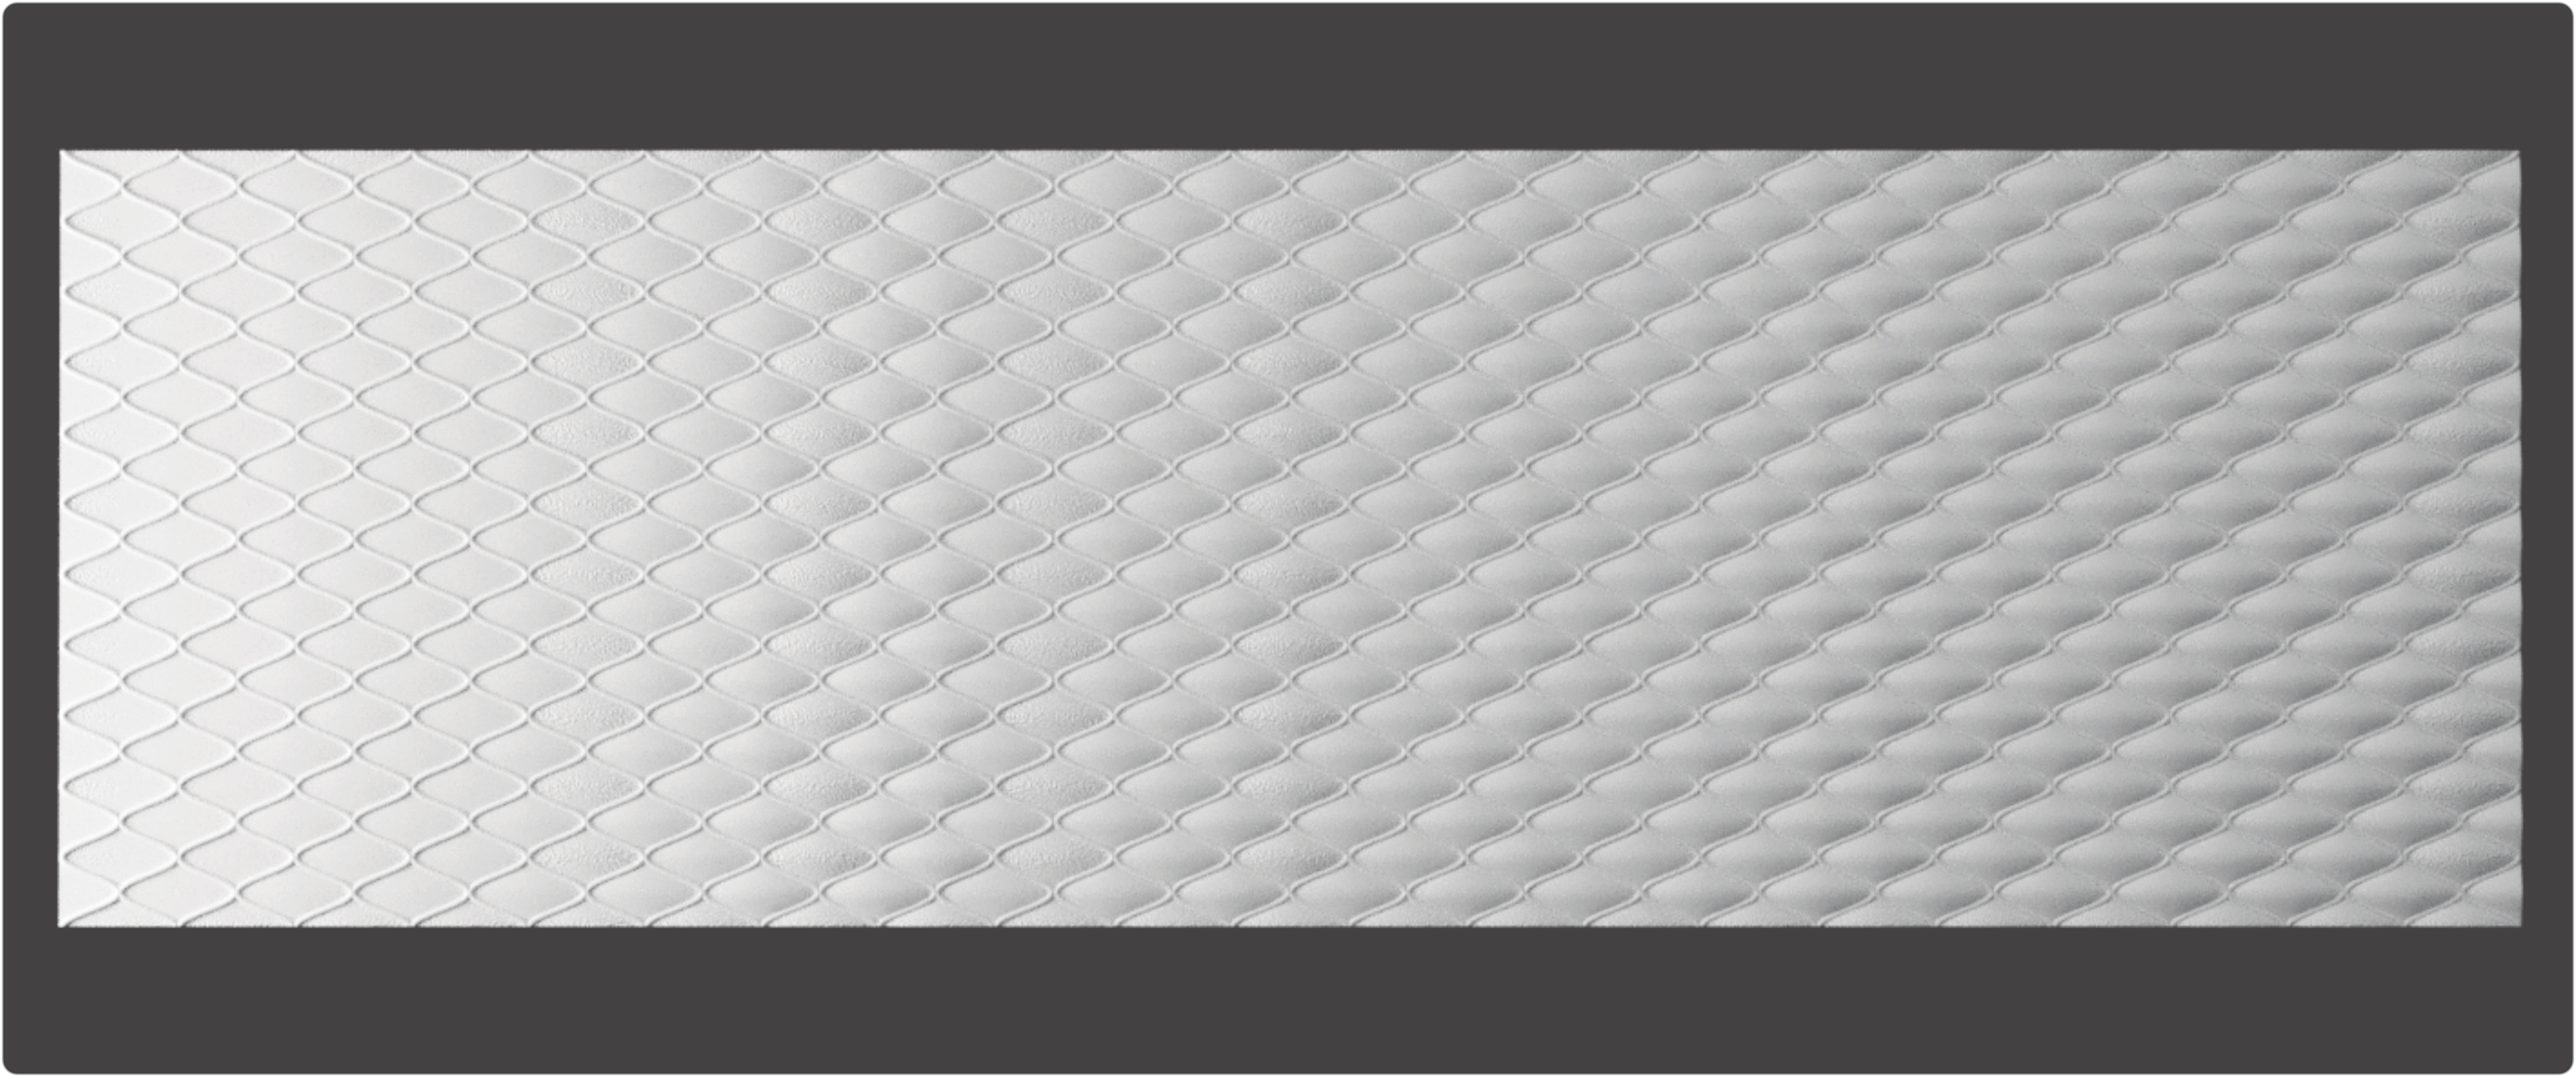
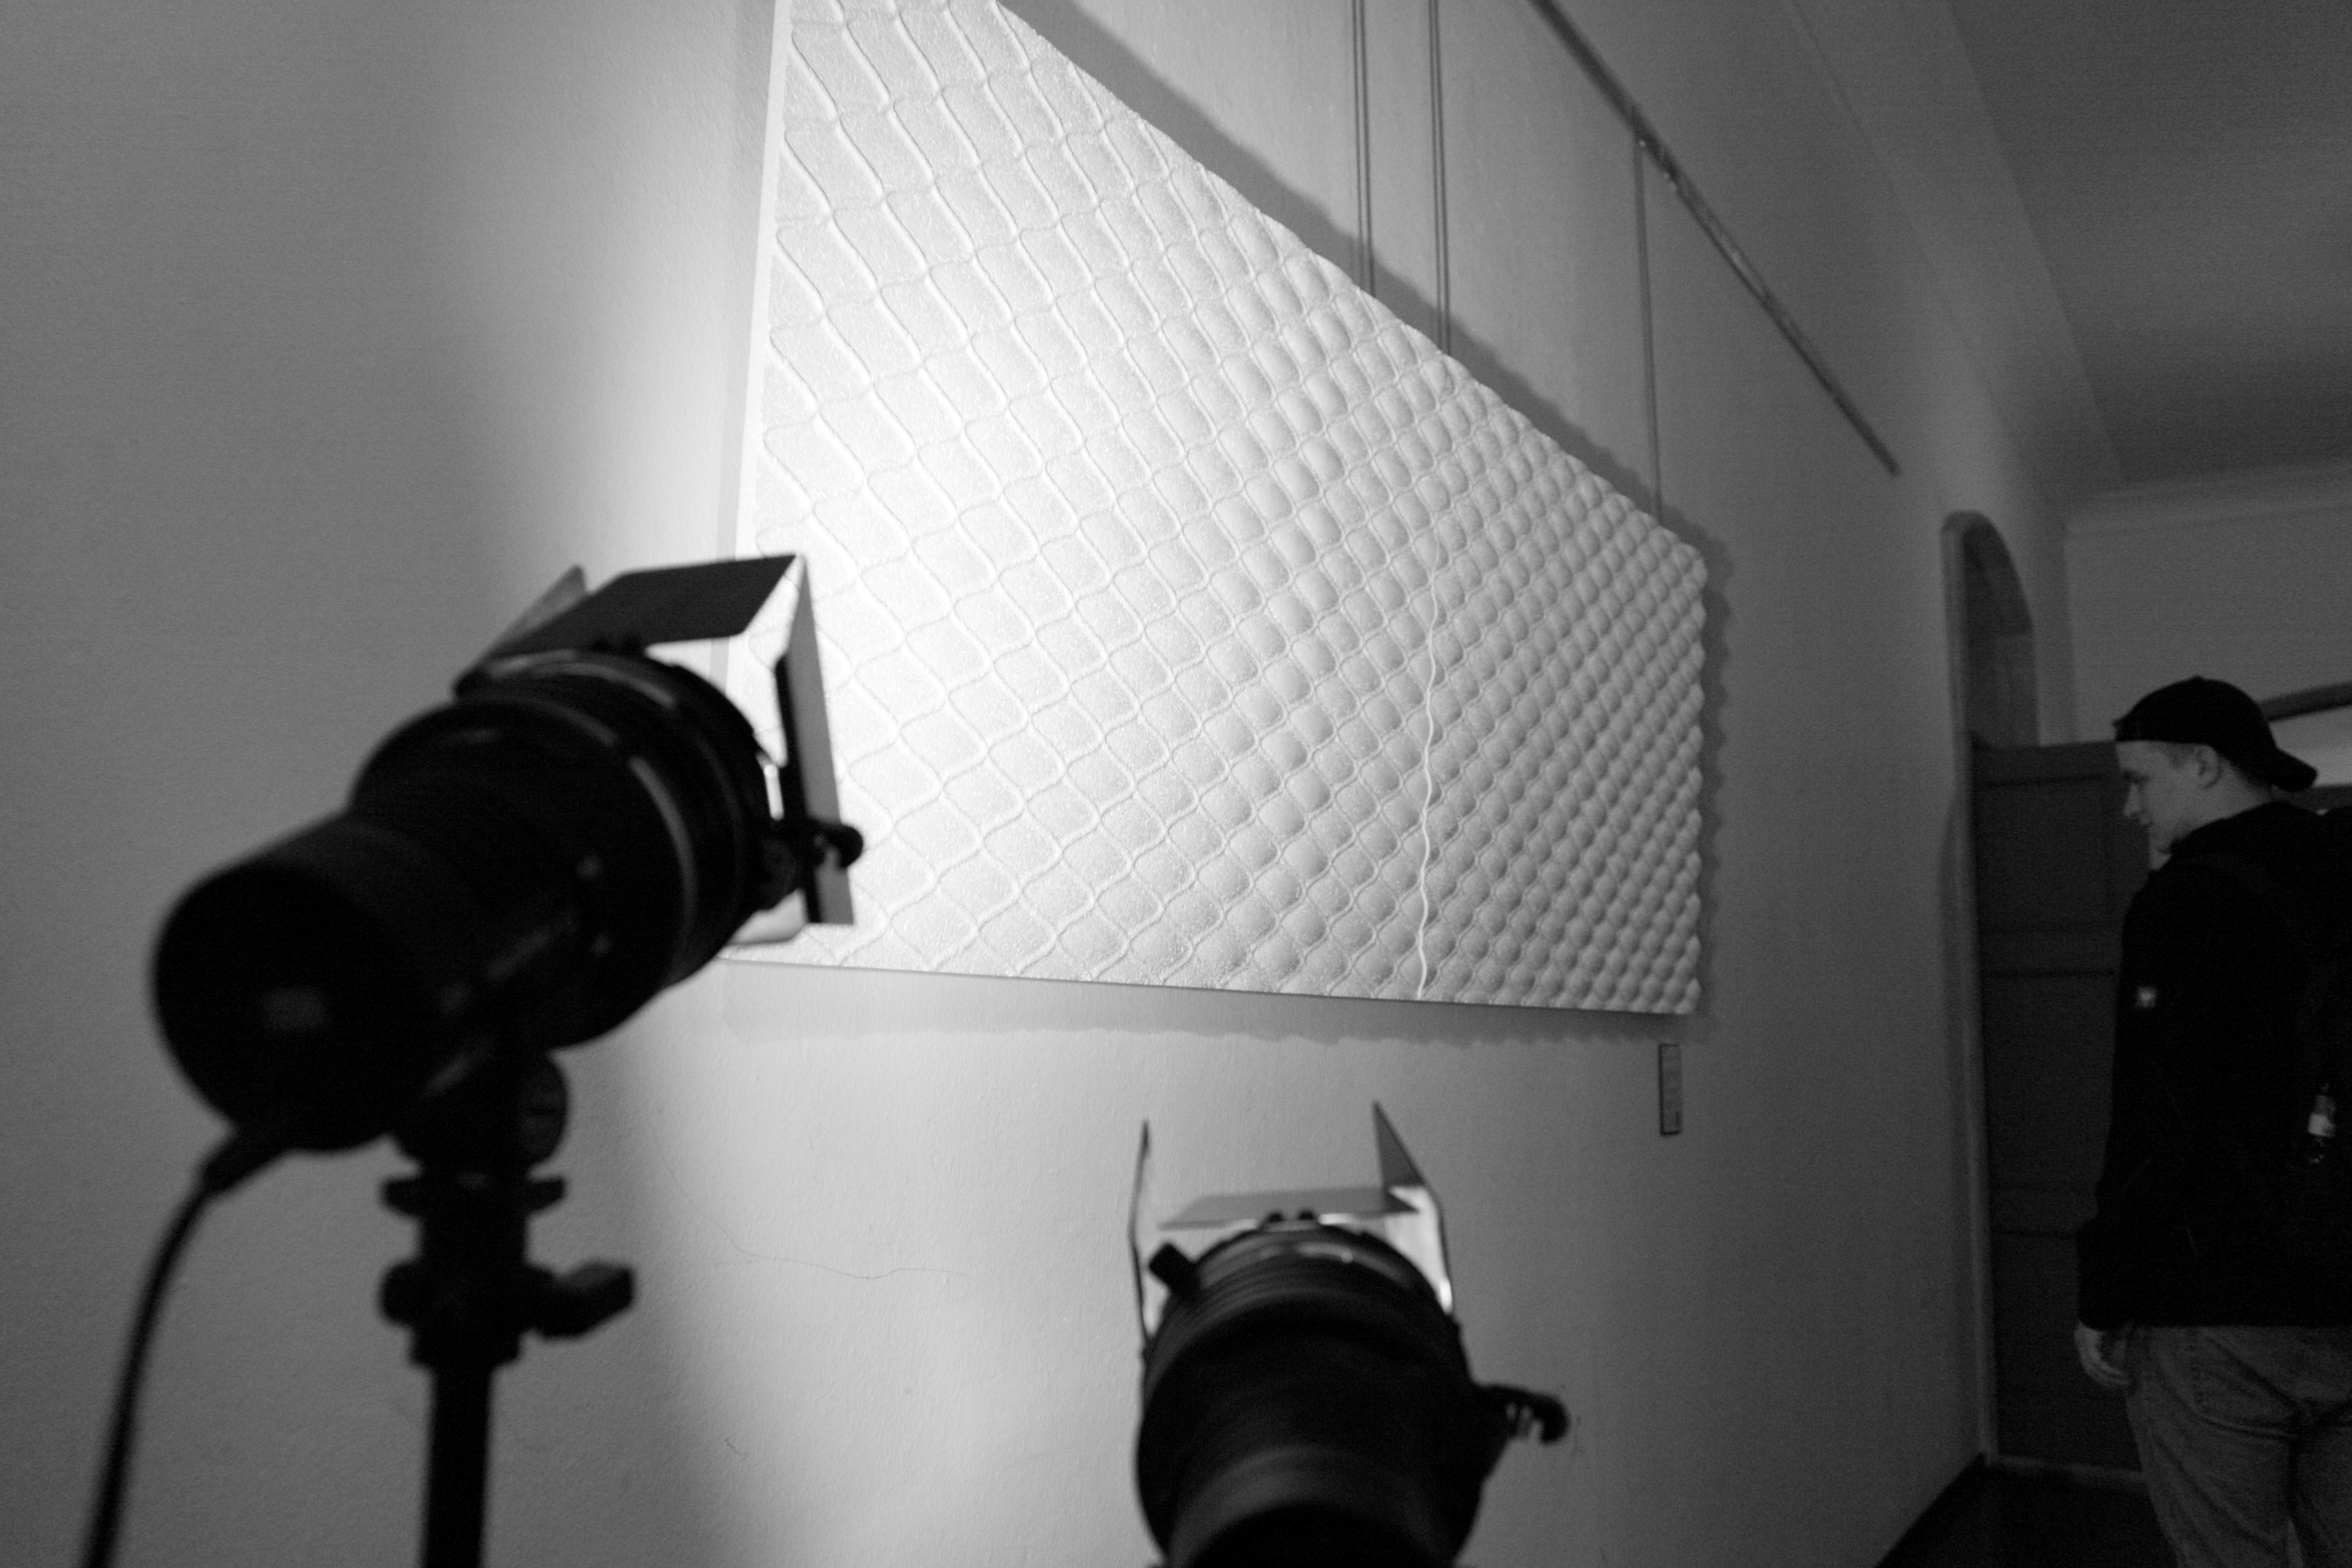
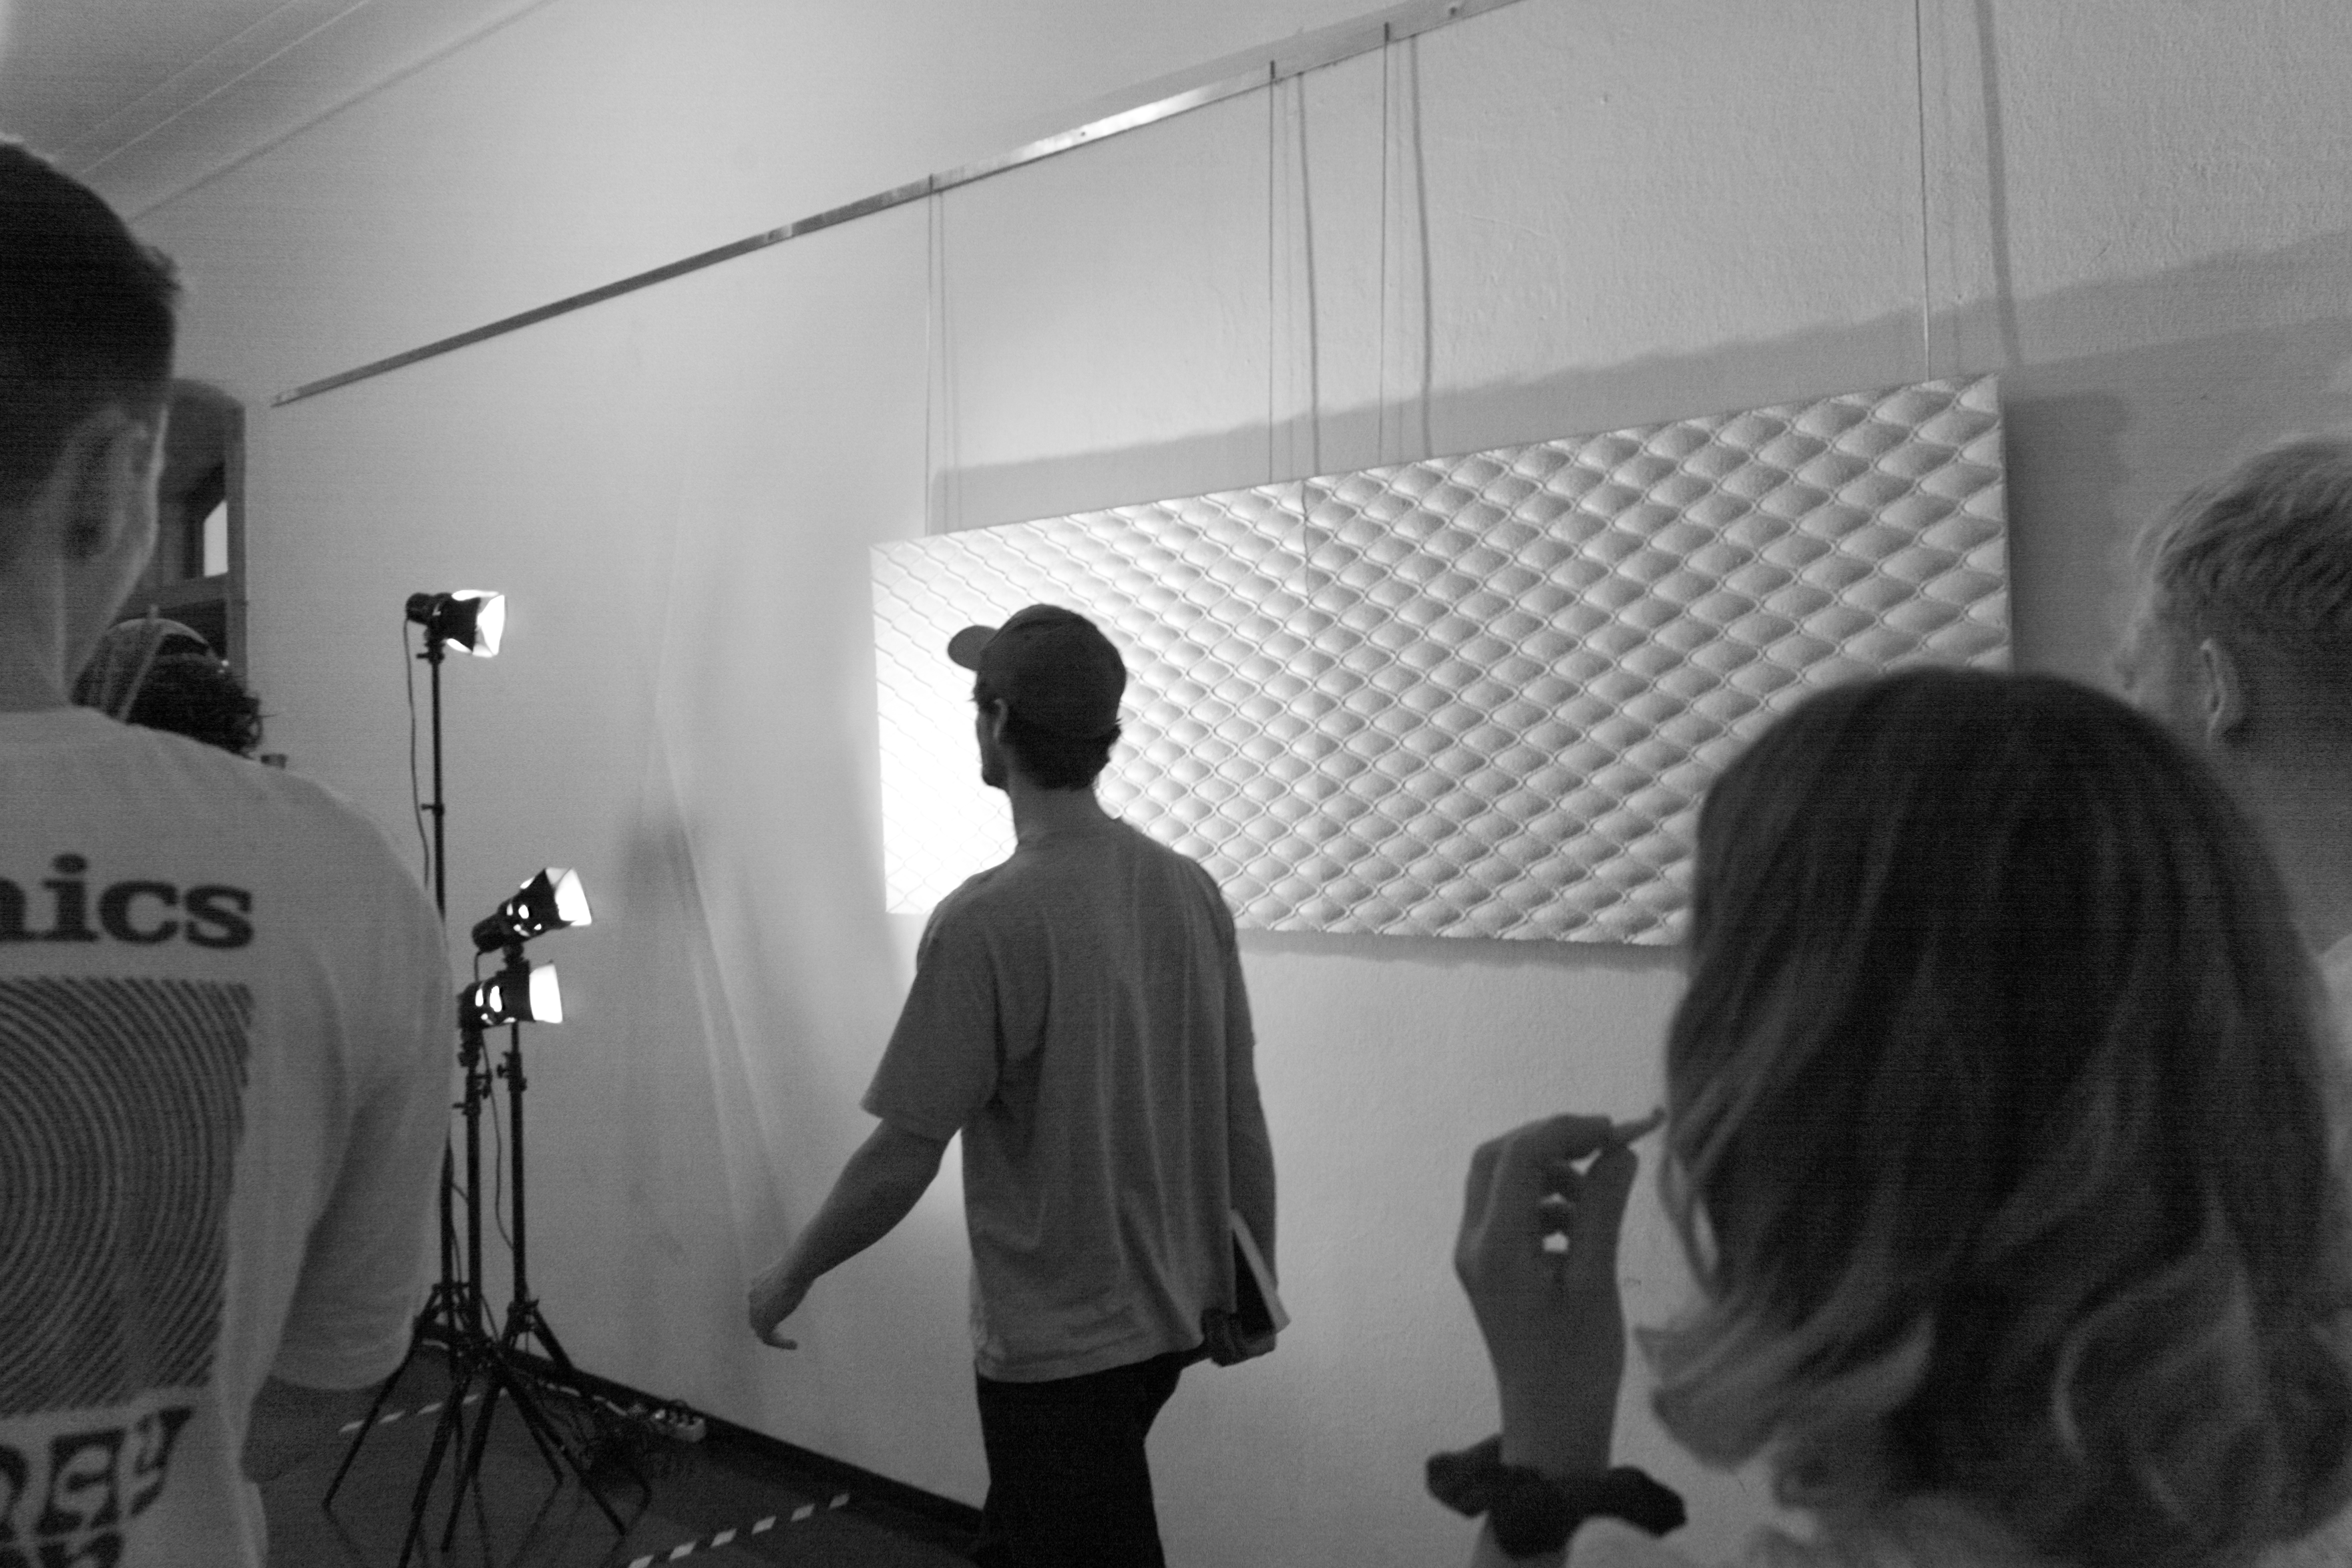
To bring this data set from digital three-dimensional form into a haptic body, I chose to manufacture it with the CNC mill.
A 22mm thick chipboard was chosen as the material, since it consists of recycled materials, among other things.
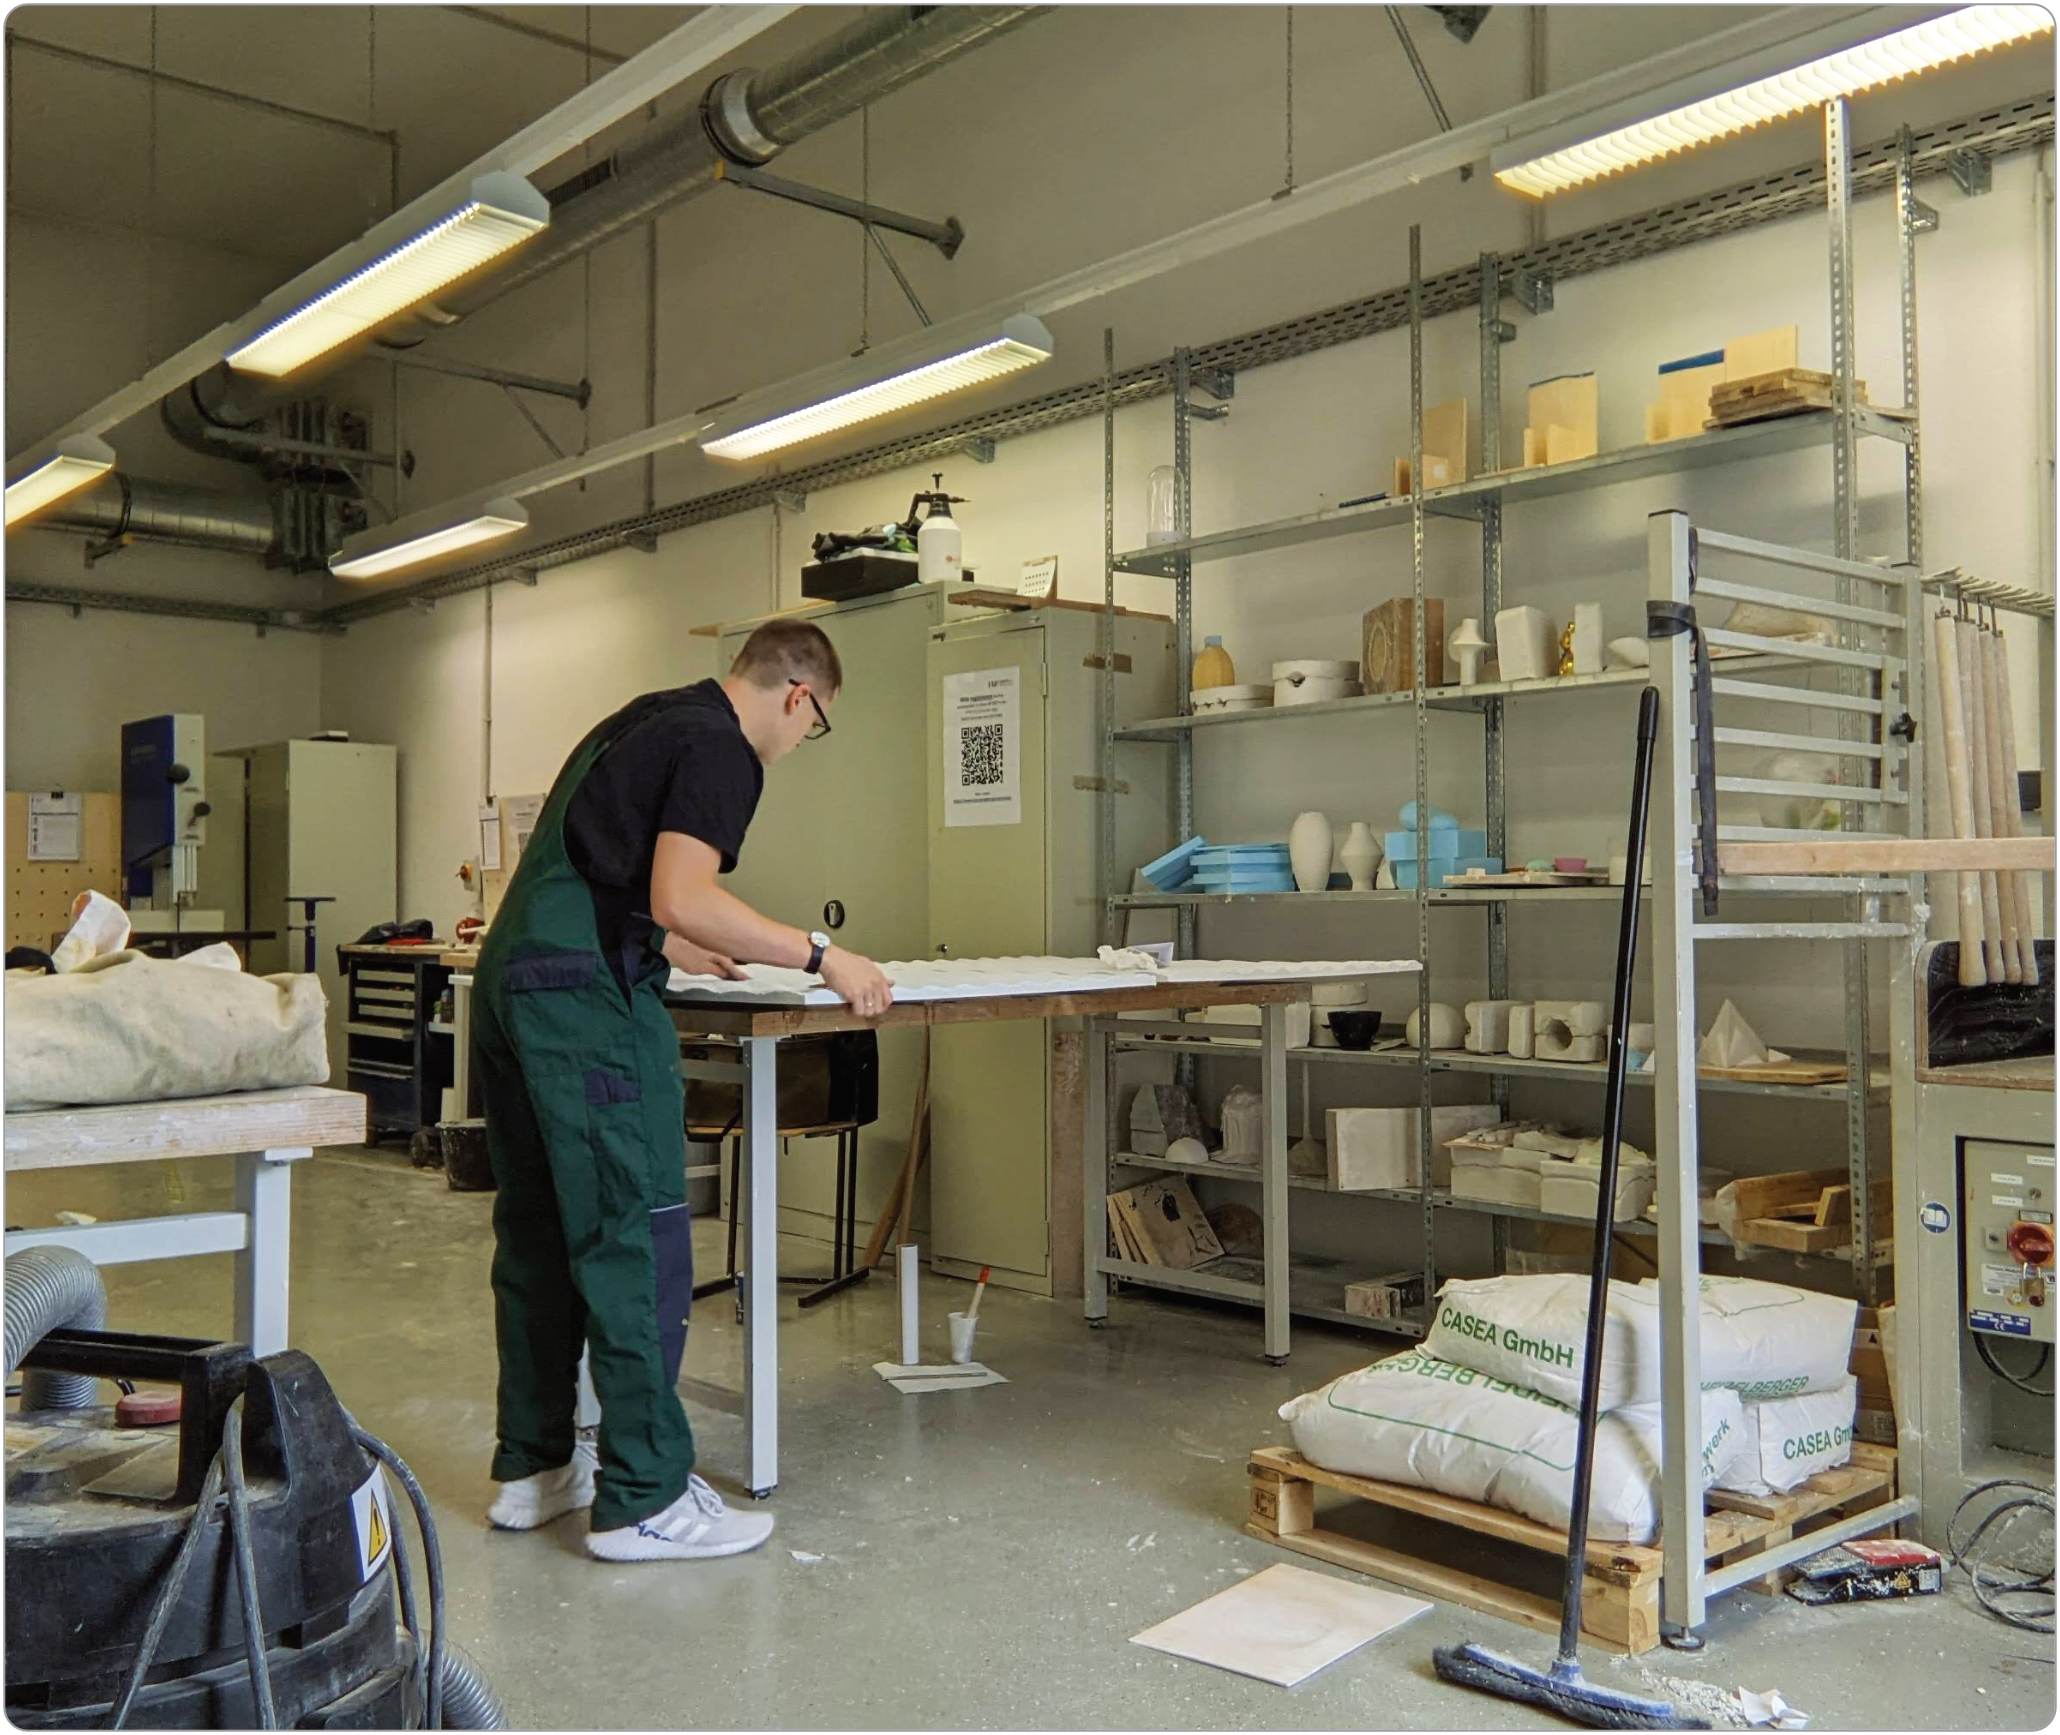
The steps for this conversion were clamping, aligning the cutter, roughing, finishing and sawing.
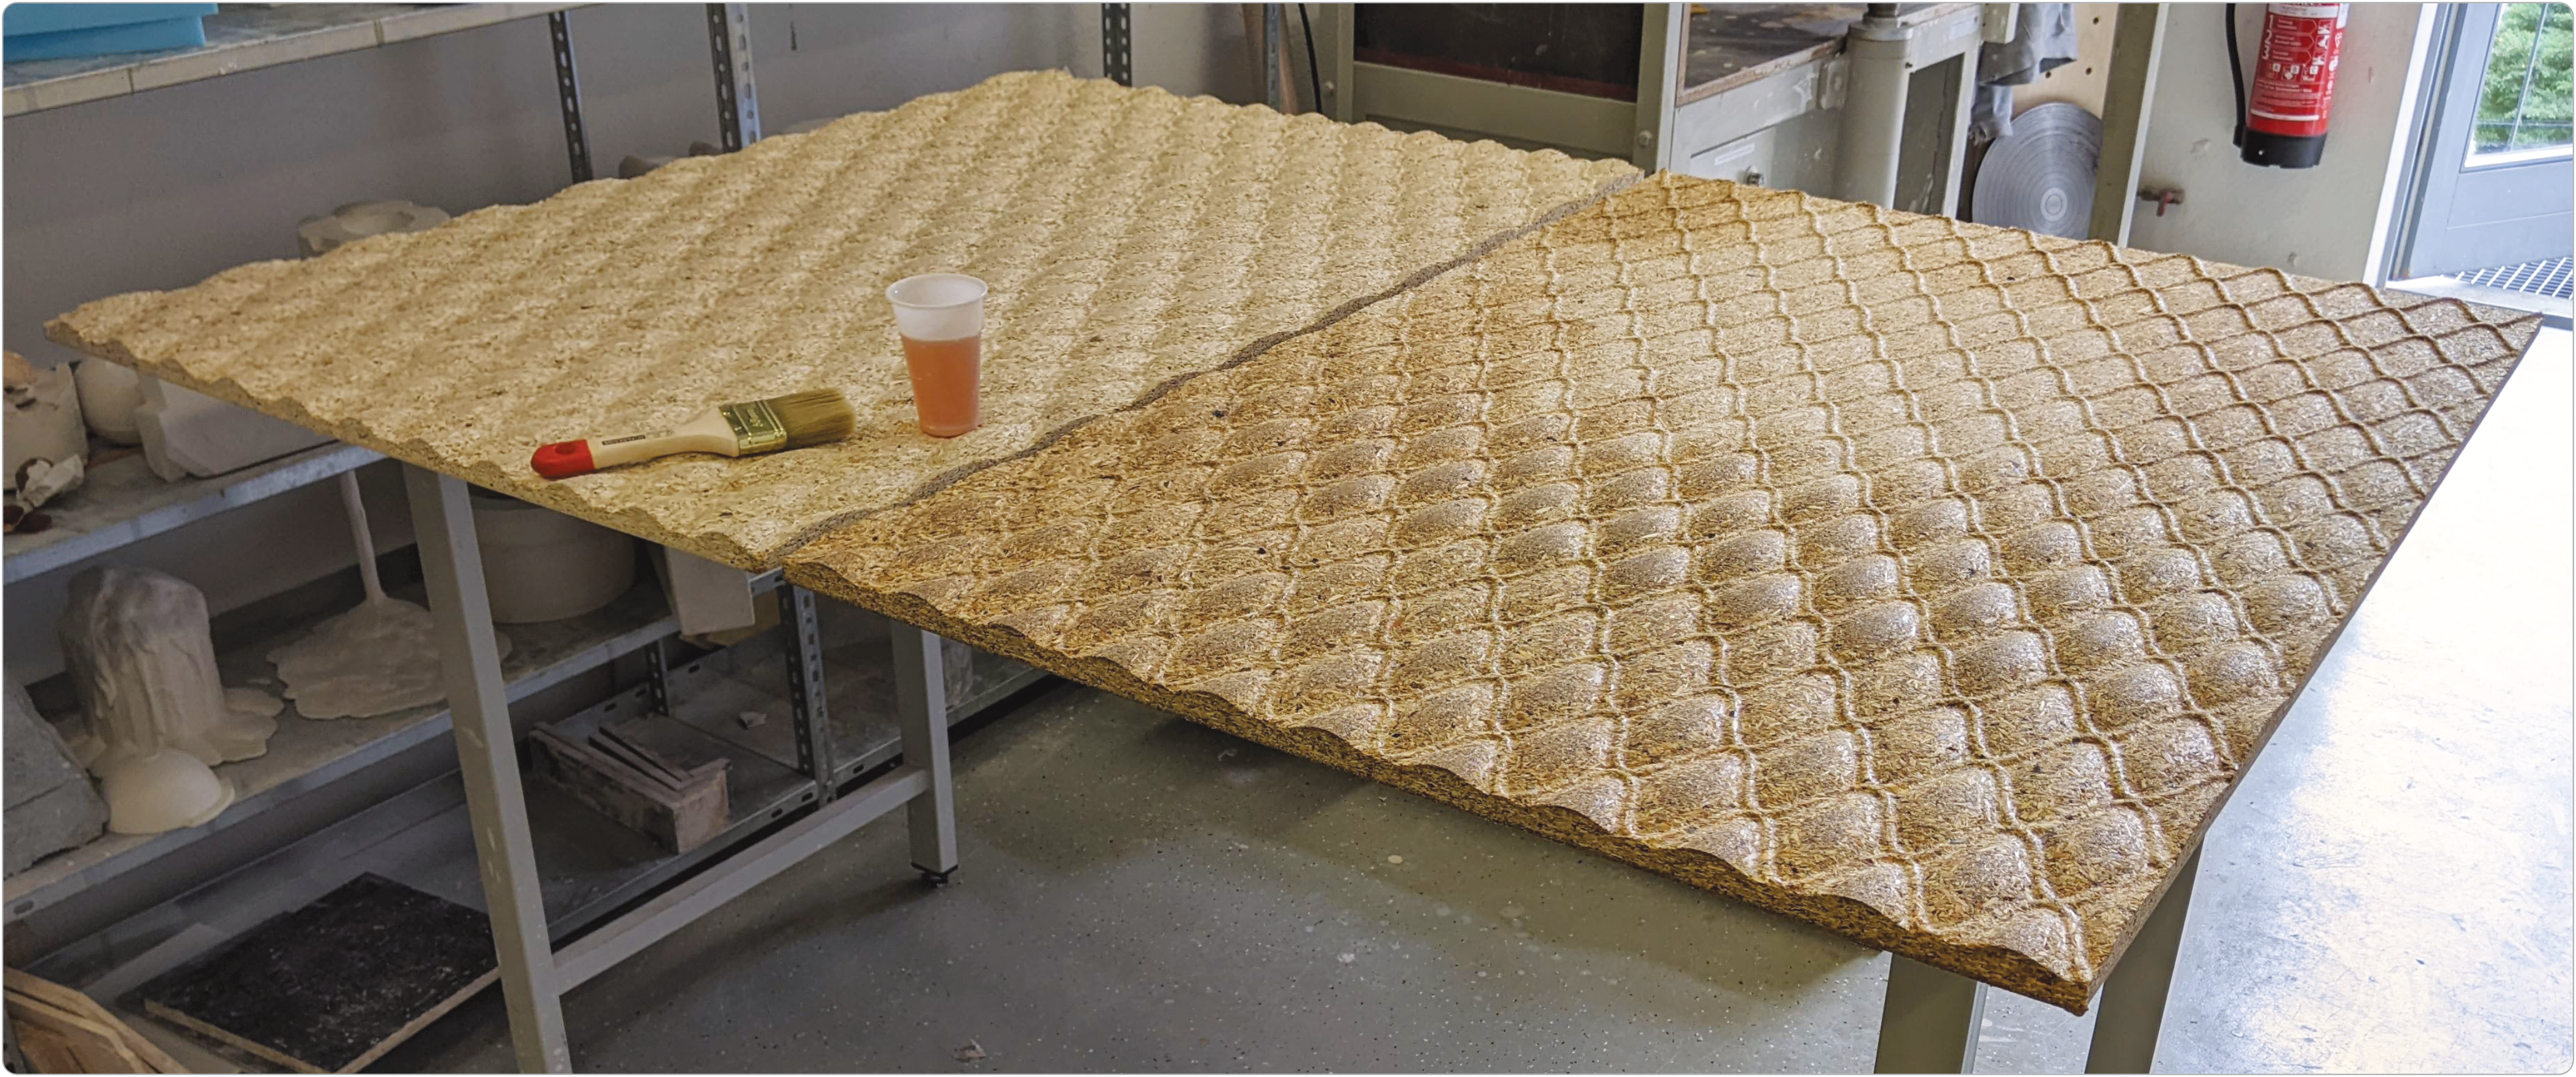
Since the milling cutter has a limited size that it can use, the object had to be made in two parts. These parts are each approx. 125cm long and 80cm wide. The time frame for milling for plate 1 took 8h for scrubbing and 12h for finishing. For plate 2 it was 12h for scrubbing and 23h for finishing.
The finished panels then had to be primed and painted several times. Here, the color white was chosen because it reproduces well the contrast created by light falling on the form.
This is an Epistemological-representational visualization as it is an adoption and extension of traditional data visualization into physical space. The values of the dataset are mapped to material variables.
I would like to extend a special thank you to Prof. Joanna Dauner and Volker Mahn for their support in this project.
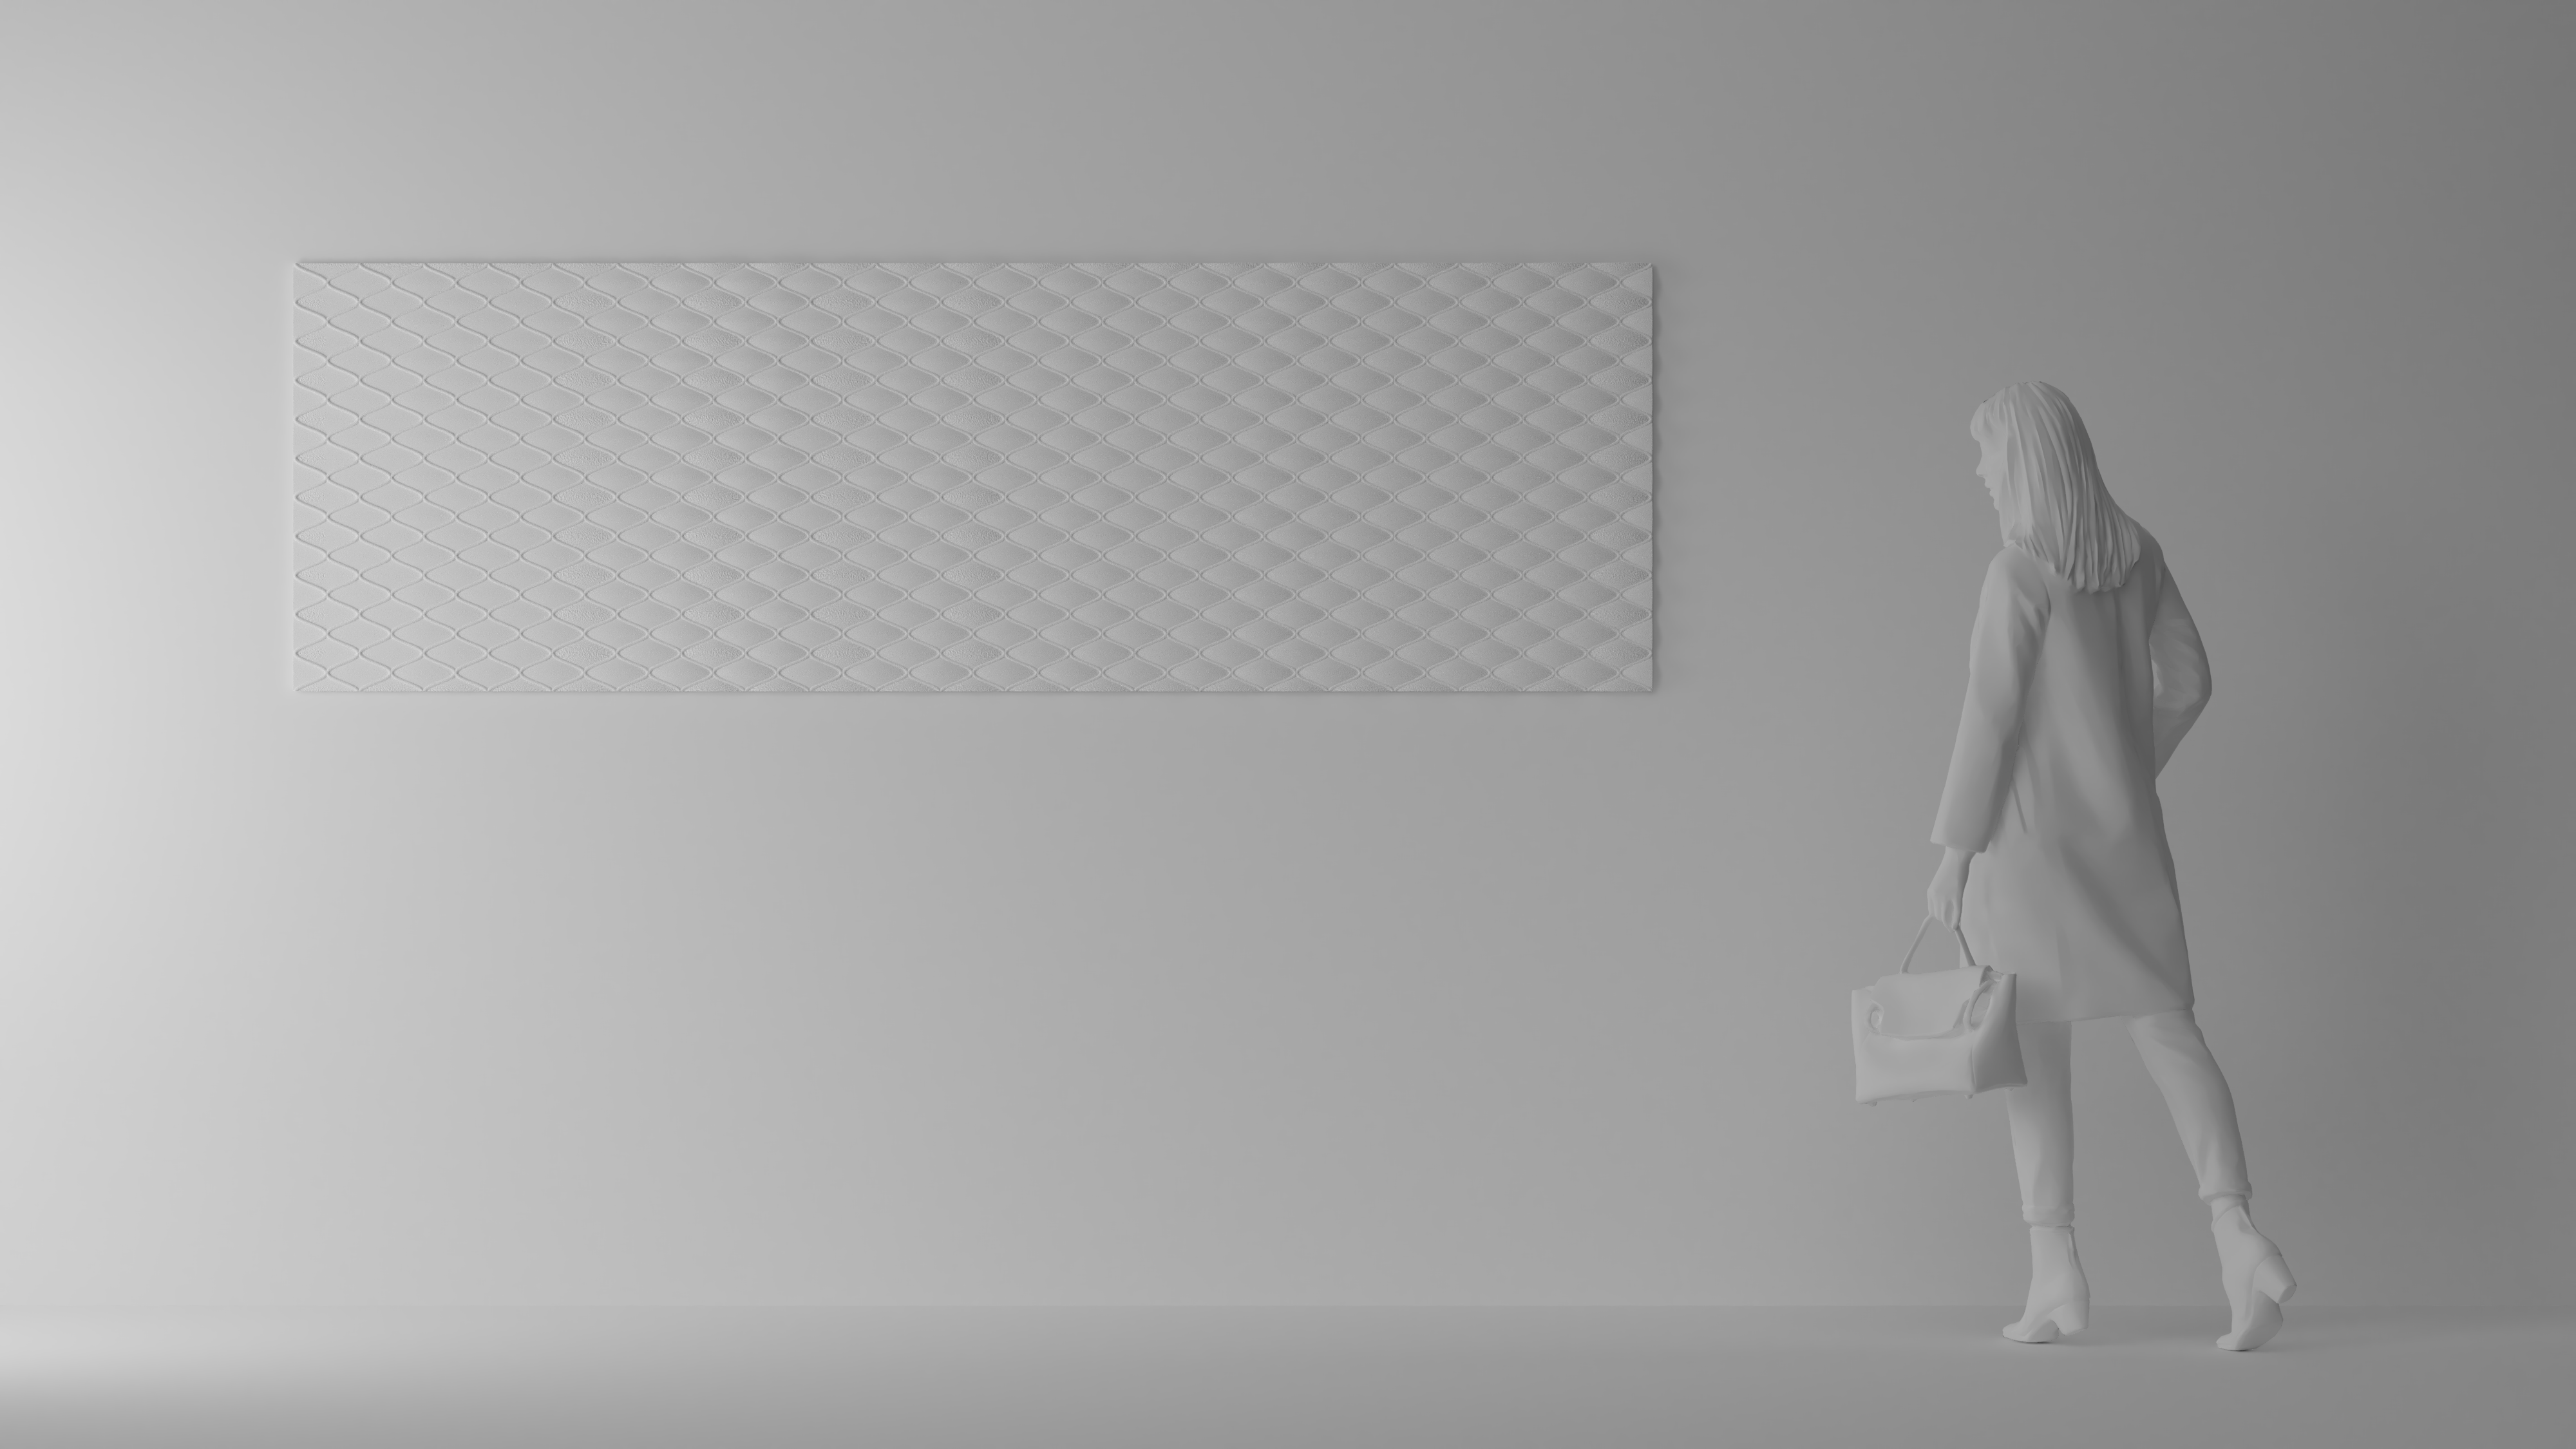
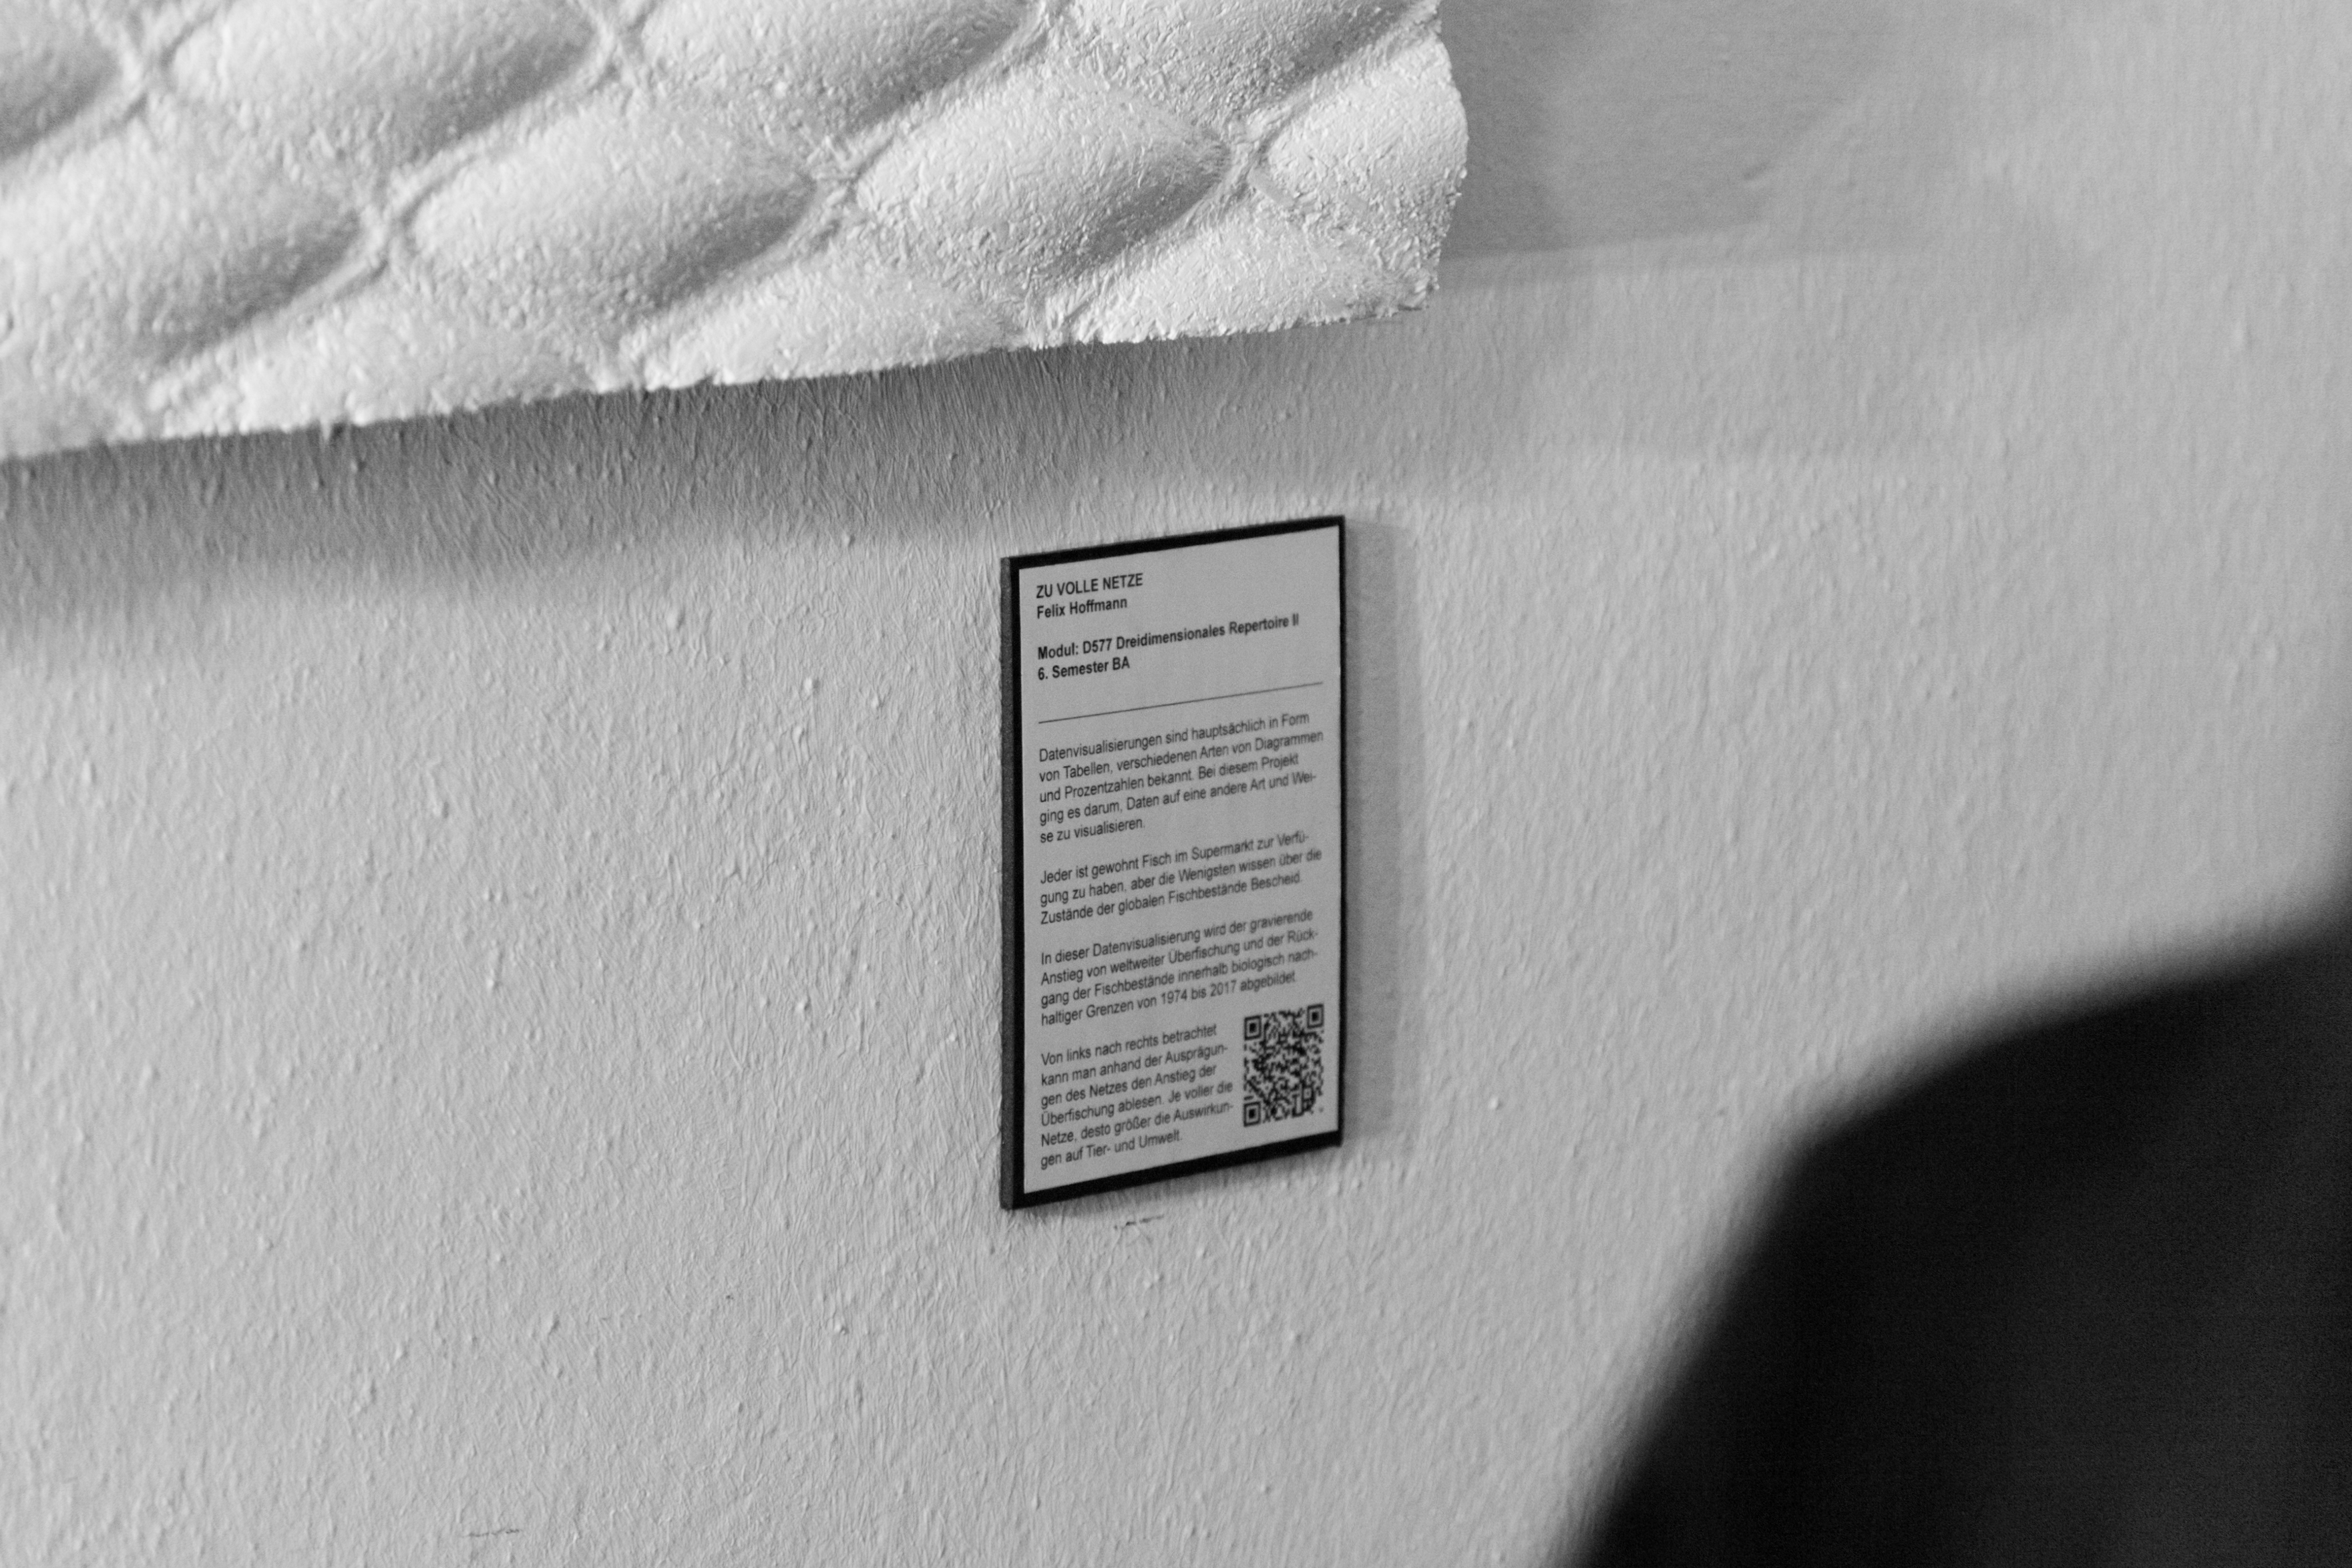
This object will be exhibited at the 2022 Werkschau in the HTW Dresden. It will be staged at eye level, as it is a topic that often takes place far below the surface of the seas and oceans. So I want to put it especially in the view of people who know fish and marine products only from the supermarket and have not yet dealt with the matter of exploitation and destruction of our oceans. The size of the object was chosen deliberately, as it represents the approximate size of a real network structure. However, since fishing nets can be up to 40km long, this is only a small representation of reality.
But no matter how big this representation is, every single one of us can make a difference in how we want to treat each other, the environment and the future of us and our descendants.
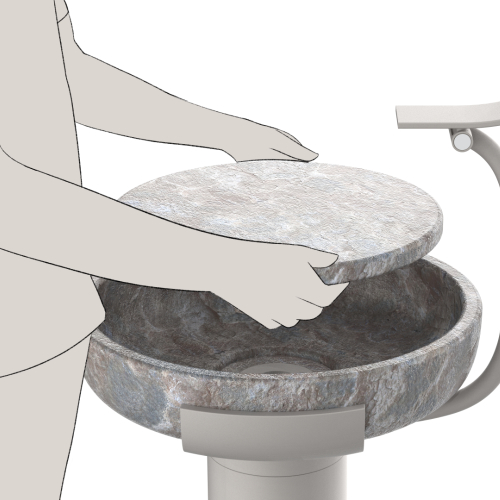
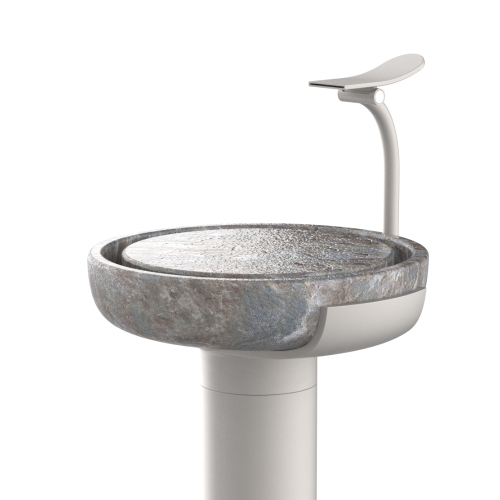
The Patera emotional Sink & Faucet Combination is not just a fixture for your kitchen or bathroom; it’s a sublime fusion of form and function, meticulously crafted to evoke a deep emotional connection with its users. Designed to transform daily routines into moments of serenity and reflection, Patera redefines the way we interact with water, making it a truly emotional experience.
The essence of Patera’s emotional design philosophy lies in its ability to create a harmonious balance between aesthetics and utility. Inspired by the serene beauty of nature, it embodies the tranquility of a flowing river or a gentle waterfall, bringing the soothing qualities of water into your living space. Patera aims to elevate the mundane act of washing into a mindful and emotive ritual.
The faucet is a masterpiece of design, featuring a brushed stainless steel body that adds a touch of modern elegance to any space. Its gentle arc mimics the graceful movement of water in nature, and the ergonomic handle provides a satisfying tactile experience as you adjust the flow and temperature.
The faucet’s water stream is carefully designed to resemble a cascading waterfall, producing a visually mesmerizing effect. The gentle, controlled flow of water encourages users to take their time and appreciate the beauty of this everyday ritual.
The Patera emotional Sink & Faucet Combination is more than just a functional fixture; it’s a poetic embodiment of water’s calming and rejuvenating qualities. With its graceful aesthetics, tactile materials, and the mindful experience it fosters, Patera transforms your daily routines into moments of emotional resonance, ensuring that your interactions with water are no longer routine but a source of joy and serenity. Welcome the Patera emotional Sink & Faucet into your home and let its emotional design elevate your everyday life.
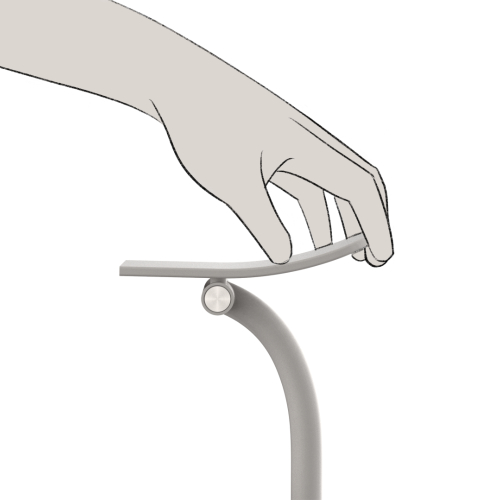
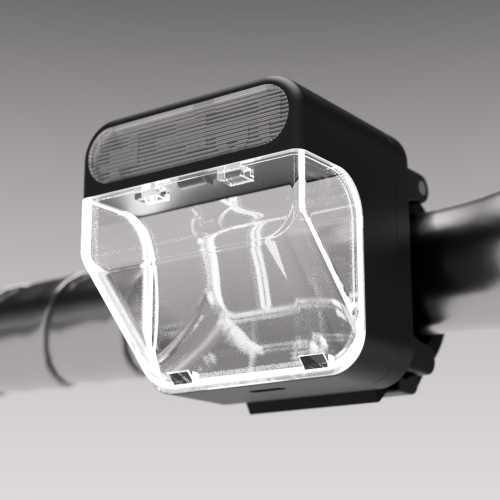
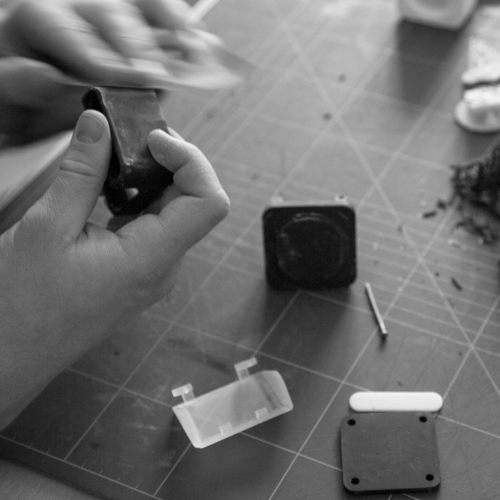
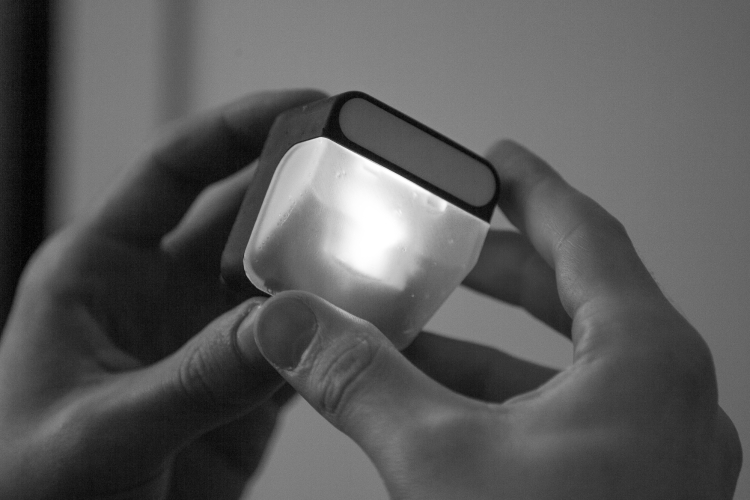
Meet Stephan, the modular bike light designed to revolutionize your cycling experience. With its innovative bayonet mount system and a wide range of accessories, Stephan is not just a bike light; it’s your partner for safer and more enjoyable rides, day or night.
Stephan’s bayonet mount is the key to its effortless attachment to your bike. Say goodbye to complicated installations and shaky fixtures. With a simple twist and click, Stephan securely locks into place, ensuring it stays put even during the most rugged rides.
Stephan is a true two-in-one solution. Its modular design allows you to use it both as a front and rear light. Whether you need to illuminate the road ahead or make yourself visible from behind, Stephan has you covered. Stephan doesn’t compromise on brightness or safety. Its high-intensity LED lights ensure you’re visible to others on the road, while the adjustable beam angle lets you tailor the illumination to your specific riding conditions.
But that’s not all – Stephan comes with a range of customizable accessories. In addition to several holders for attaching the lamp to the bike itself, a handle was also designed for use as a flashlight and a clip for attaching the light, for example when jogging or on a stroller.
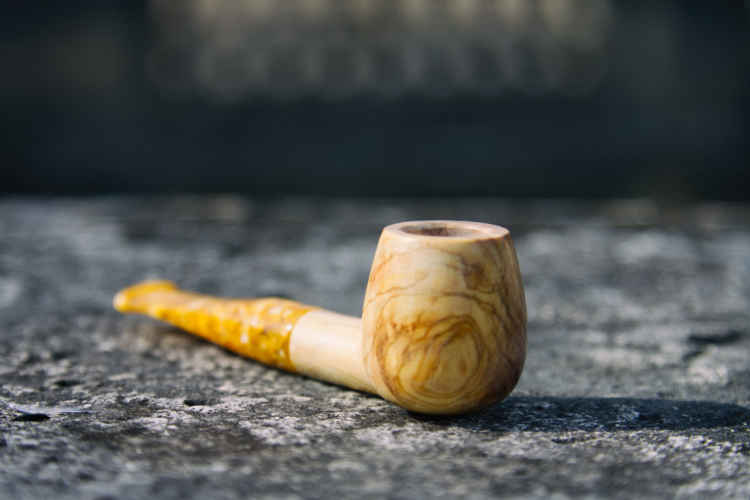
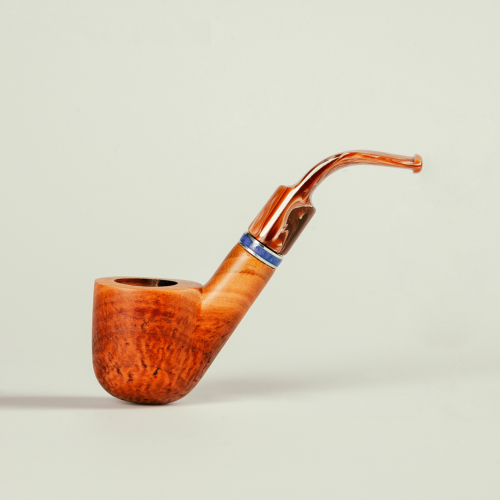
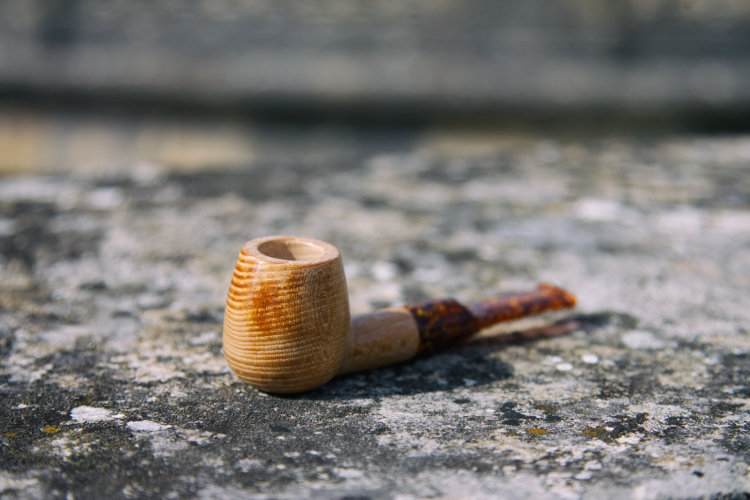
Bent Pipe Charles
2019 – Lifestyle
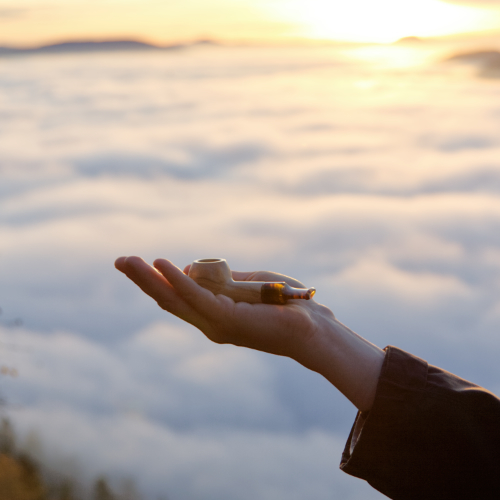
Elevate your smoking experience with our meticulously crafted Handcrafted Bent Tobacco Pipe, a testament to the timeless art of pipe making.
The first thing you’ll notice is the exquisite design, where form meets function in perfect harmony. The pipe boasts a gracefully bent stem, ergonomically designed for comfort during your smoking sessions. Its elegant curves and organic lines not only provide a comfortable grip but also exude an air of sophistication that only comes from a finely crafted piece.
The Handcrafted Bent Tobacco Pipe is not just a smoking instrument; it’s a work of art. The meticulously carved details on the bowl, stem, and shank showcase the artisan’s skill and attention to detail. Each pipe is a unique creation, with its own distinct grain pattern and personality, making it a collector’s item to be cherished for generations to come.
Craftsmanship aside, this pipe is designed for ease of use. The well-balanced weight distribution ensures a comfortable hold, while the precisely engineered airflow guarantees a smooth and satisfying smoking experience. Lighting up has never been so effortless and enjoyable.
Whether you’re a seasoned pipe aficionado or a newcomer to the world of tobacco pipes, the Handcrafted Bent Tobacco Pipe promises to elevate your smoking ritual to an entirely new level. With its timeless beauty and exceptional craftsmanship, it’s more than just a pipe; it’s a statement of style and a celebration of the art of pipe making.
Leather Bag Bruno
2019 – Lifestyle
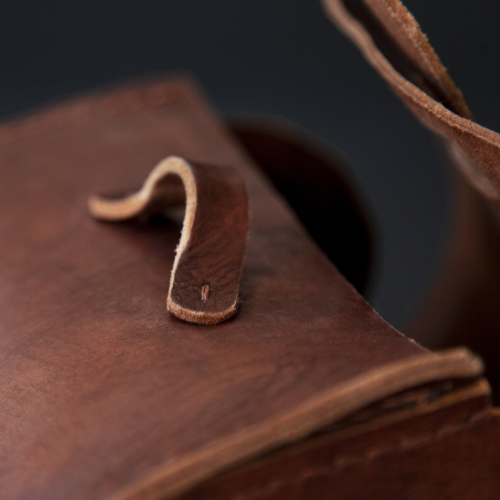
Elevate your pipe-smoking experience with „Bruno,“ a masterpiece of craftsmanship and style designed exclusively for aficionados of tobacco ware. Handcrafted with precision and passion, this exquisite leather bag is more than just an accessory; it’s a statement of sophistication and an embodiment of timeless elegance.
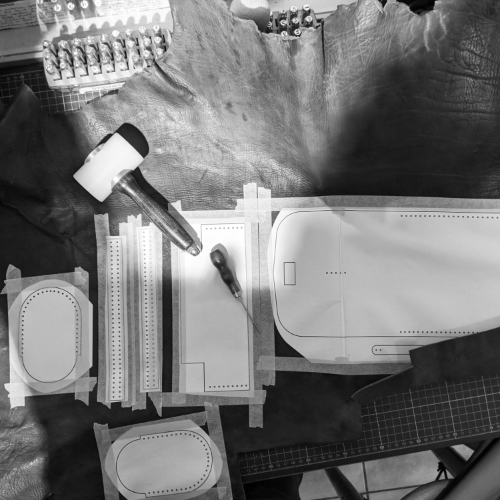
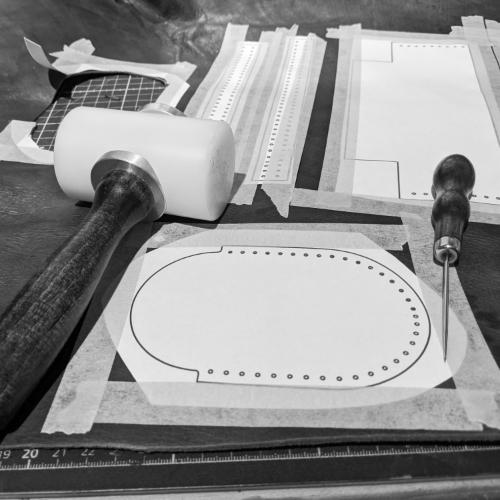
The Bruno bag is a labor of love, meticulously crafted by skilled artisans who pour their expertise and attention to detail into every stitch. Made from premium full-grain recycled buffalo leather, it exudes an aura of refinement that only improves with age, developing a rich patina unique to its owner.
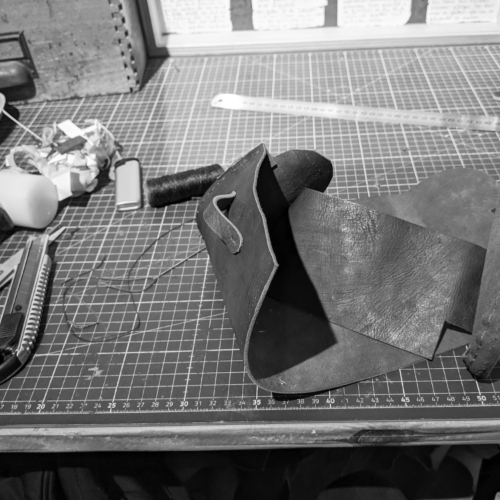
Bruno is not just a showcase piece; it’s engineered for practicality. Featuring specially designed compartments and pockets, it’s the perfect companion for your pipes, tobacco, and accessories. With ample room for multiple pipes, tobacco tins, pipe cleaners, lighters, and more, it keeps your essentials organized and easily accessible.
Bruno’s classic design transcends trends, making it a timeless accessory that complements any style. Its rugged yet refined appearance pairs effortlessly with both formal attire and casual wear, reflecting the personality of those who appreciate the finer things in life.
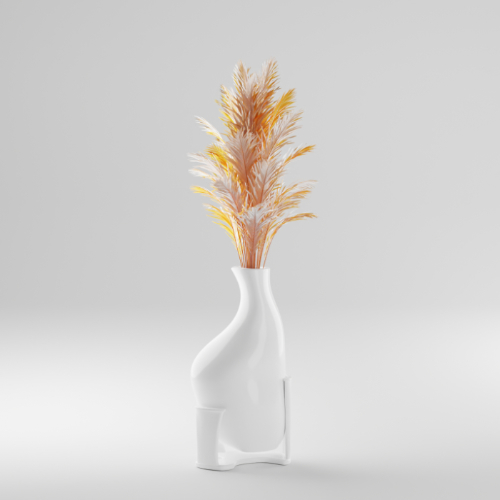
How can designers work with artificial intelligence? Will designers become interchangeable once AIs have been extensively trained and generate convincing results? Who takes on which roles? These questions formed the starting point for the project “Vase – Designed By Human, AI and Algorithms”. The aim was to work with artificial intelligence (AI) and to focus on a cooperative approach as designers to engage in the design process. AIs should not be viewed as a danger that will gradually replace humans as workers. This project was more about bringing together the skills of humans and machines so that they can complement each other. The result of the project was a series of vases that were formed by humans, AI and algorithms. The strengths, weaknesses and potential of collaboration between humans and machines should be reflected in the design process as well as in the finished product.
This project has been presented several times in an exhibition context, for example in the GEH8 exhibition in Dresden and in the COSMO Wissenschaftsforum Dresden in the Kulturpalast Dresden.
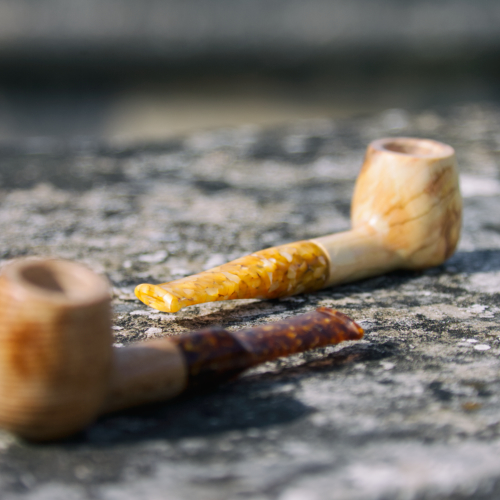
Summer Collection
2022 – Lifestyle
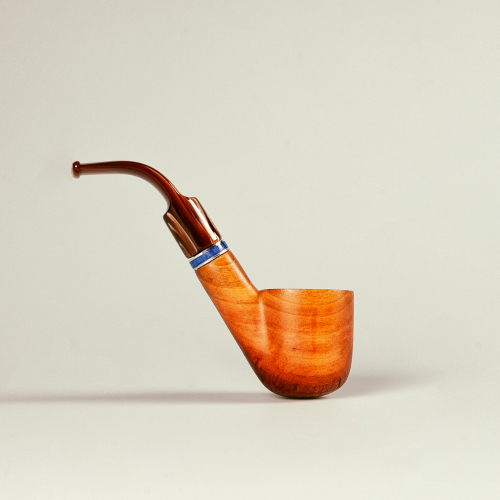
Step into a world of timeless elegance and leisure with our exquisite Summer Tobacco Pipe Collection. Crafted with precision and passion, this curated selection of tobacco pipes is a celebration of summer’s golden moments and the artistry of pipe smoking. Each pipe in this collection embodies the essence of summer, capturing the warmth of sun-drenched days, the nostalgia of lazy afternoons, and the joy of savoring fine tobacco in the great outdoors.
Smoking a pipe is a pleasure that is second to none. In order to transfer this enjoyment into the summer mood, a series of pipes was designed that reflects summer through different woods and grains, warm colors and refreshing shapes.
Each pipe in this collection has been meticulously crafted with a keen eye for elegance. The shapes and contours of the pipes are not only functional but also visually appealing. The clean lines, smooth finishes, and attention to detail are a testament to the elegance of classic pipe design.
Elegance often lies in balance, and these pipes achieve just that. The proportions of the bowls, stems, and decorative elements are carefully considered to create a harmonious and visually pleasing whole. This sense of balance adds to the overall classic appeal.
In summary, the Summer Tobacco Pipe Collection not only embodies the elegance and classicism of traditional pipe craftsmanship but also offers a gateway to a world of refined pleasures. These pipes are more than just smoking instruments; they are pieces of art that celebrate the enduring allure of timeless design and the satisfaction of embracing a classic ritual in the modern world.
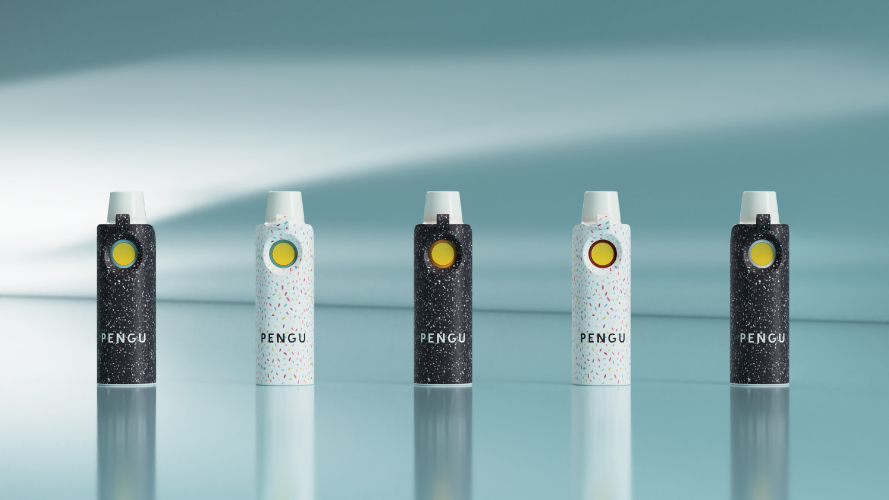
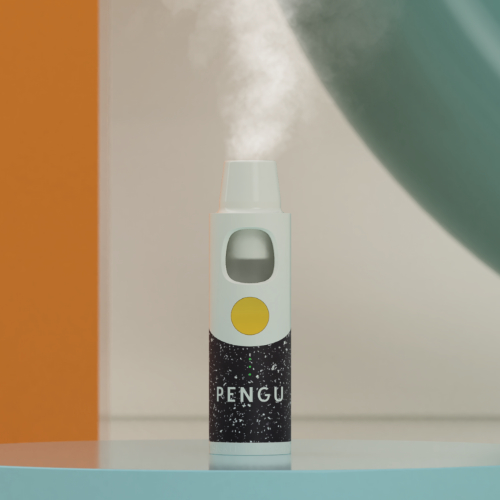
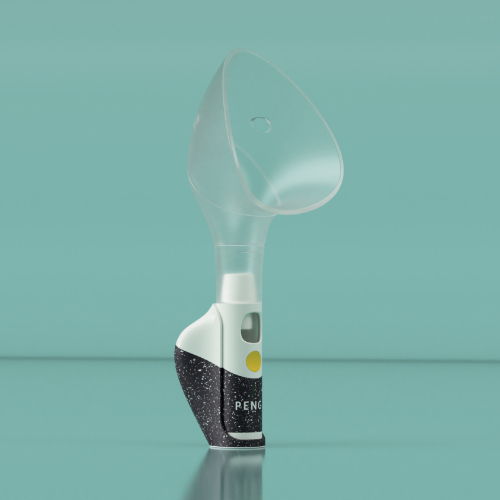
PENGU Inhaler
2023 – Medical Design
Conception of a medical device that can be used for inhalation by nebulizing various substances and that contributes to the relief and prevention of respiratory diseases in a young target group.
The PENGU inhaler was developed specifically for the target group of 6-16 year old users. The user-friendly design makes PENGU easy to understand and use, allowing children and teenagers to use the inhaler independently. The device does not require special coordination between the operation of the inhaler and the breathing technique, which makes it easy to use for children.
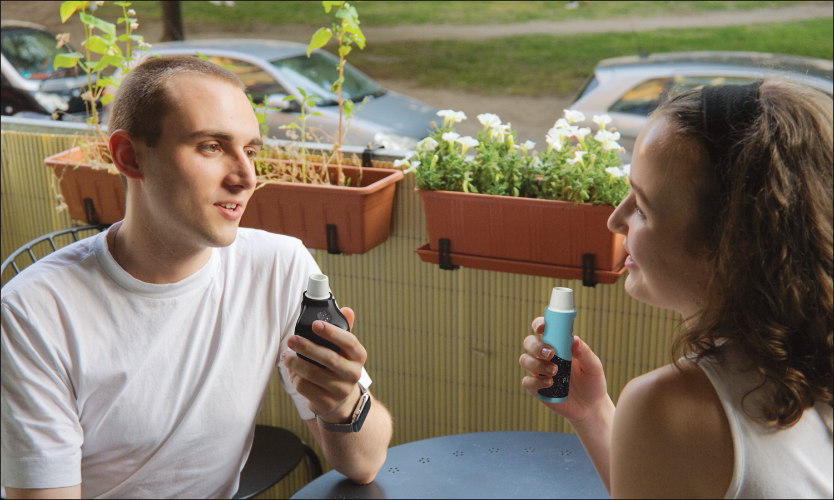
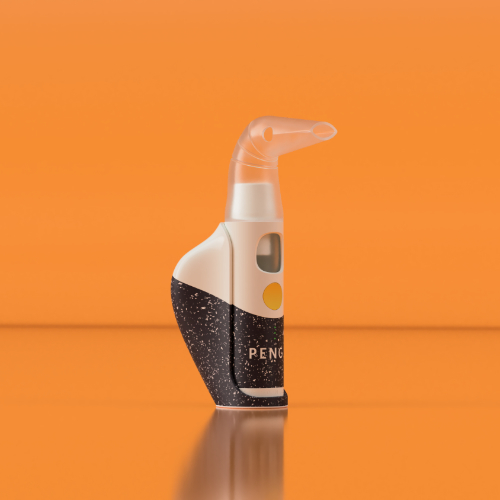
Compared to most conventional devices, PENGU is lighter, which is particularly pleasant for young users. The low weight allows for comfortable handling and increases the portability of the device.
The inhaler’s modular design allows for easy maintenance and expandability. Various components can be easily replaced or upgraded to meet users‘ individual needs.
An Ergo Grip, a holder for hanging the device around your neck, several mask attachments and a docking station for charging were designed for this inhaler. The membrane technology enables effective and quiet use.
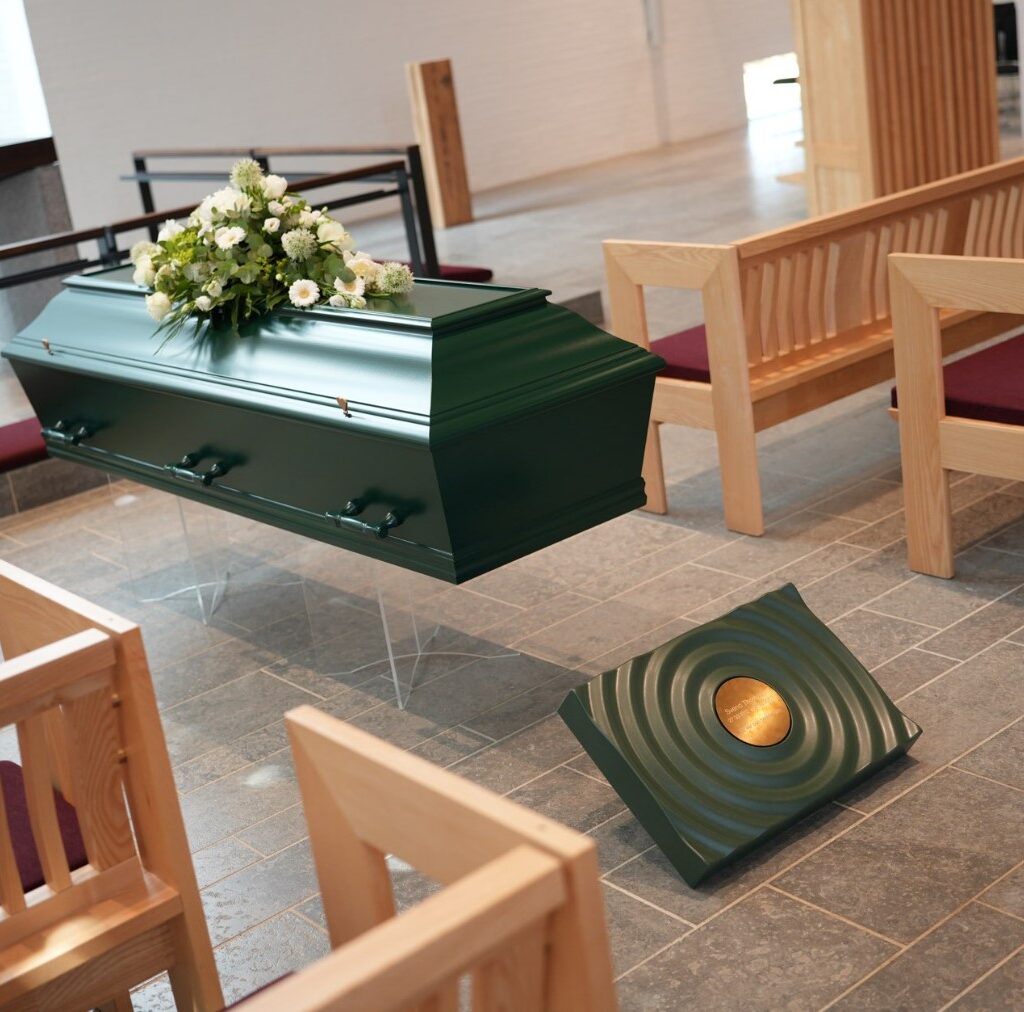
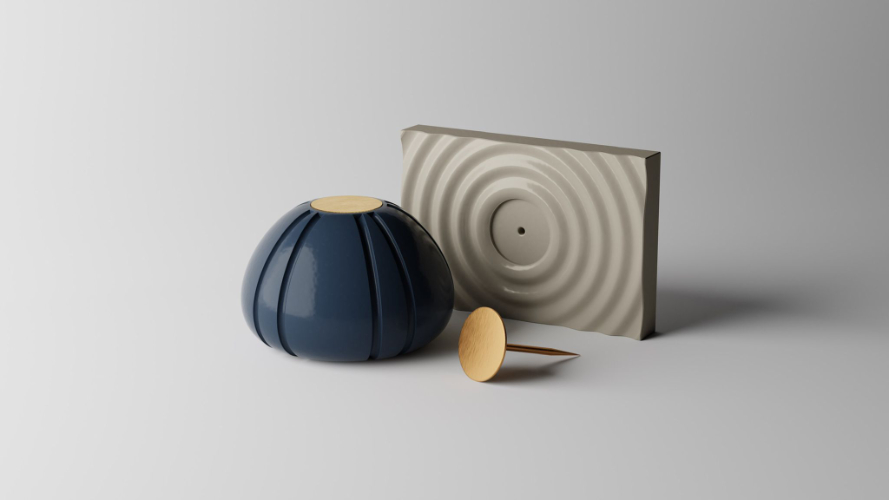
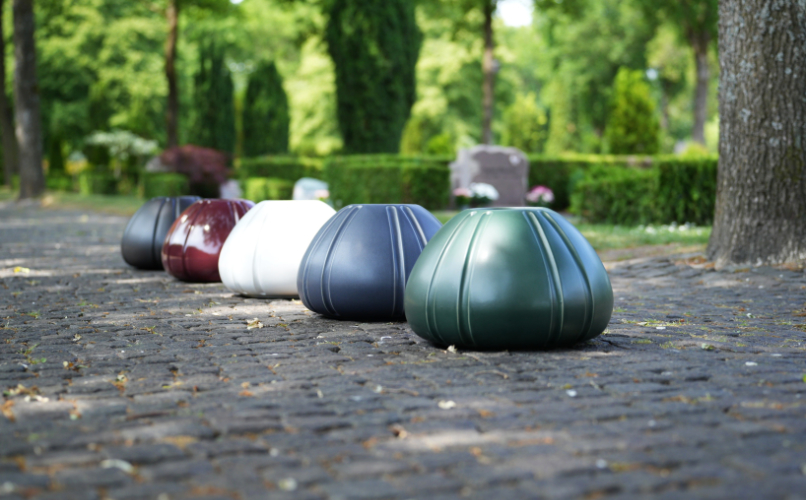
We have rethought the traditional way of producing memorial stones and memorial plates by making the first series-produced memorial stones in Danish history based on sustainability in a material other than granite – namely clay. We have done it without compromising on aesthetics and functionality.


